

Project Monitoring
From the Project sidebar, open Monitoring to view metrics for all containers within the Project. If the Project contains multiple containers, their metrics are displayed together on the same chart with separate legends for comparison.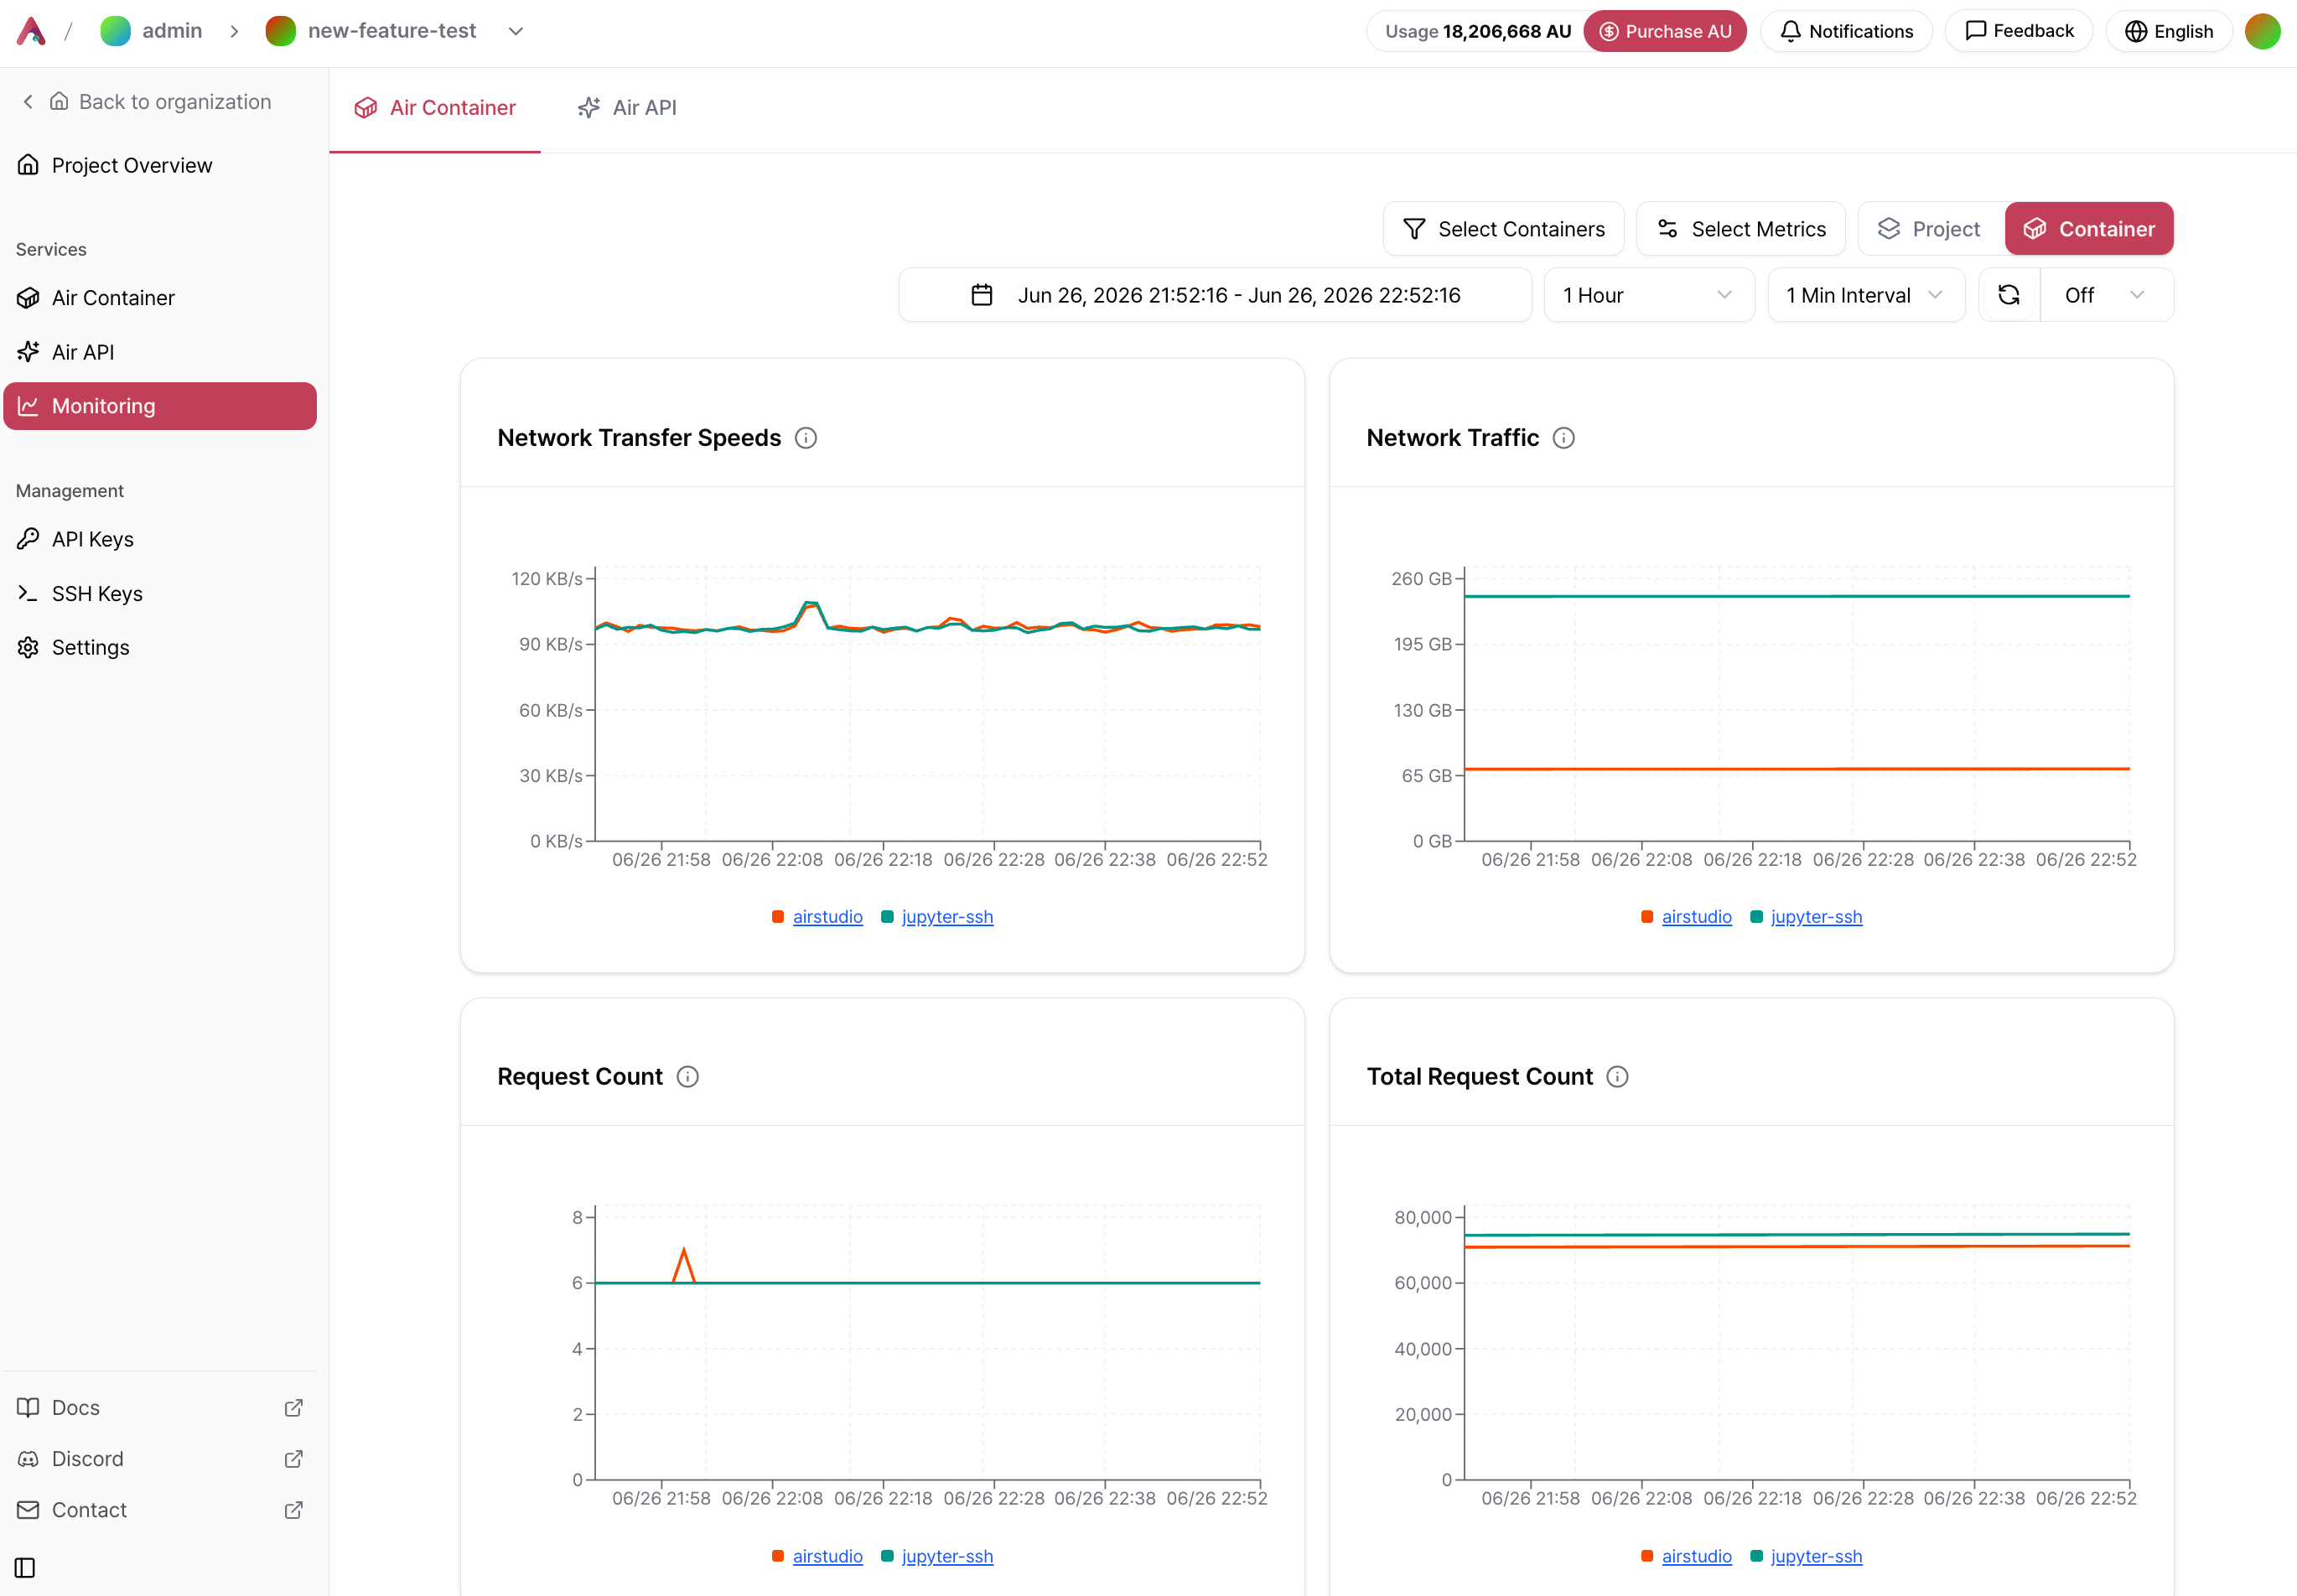
Filters and Display Options
Container Monitoring
From an individual container page, open Monitoring to view detailed metrics for that container. Use the metric selector in the upper-right corner to customize the dashboard and display only the metrics you need.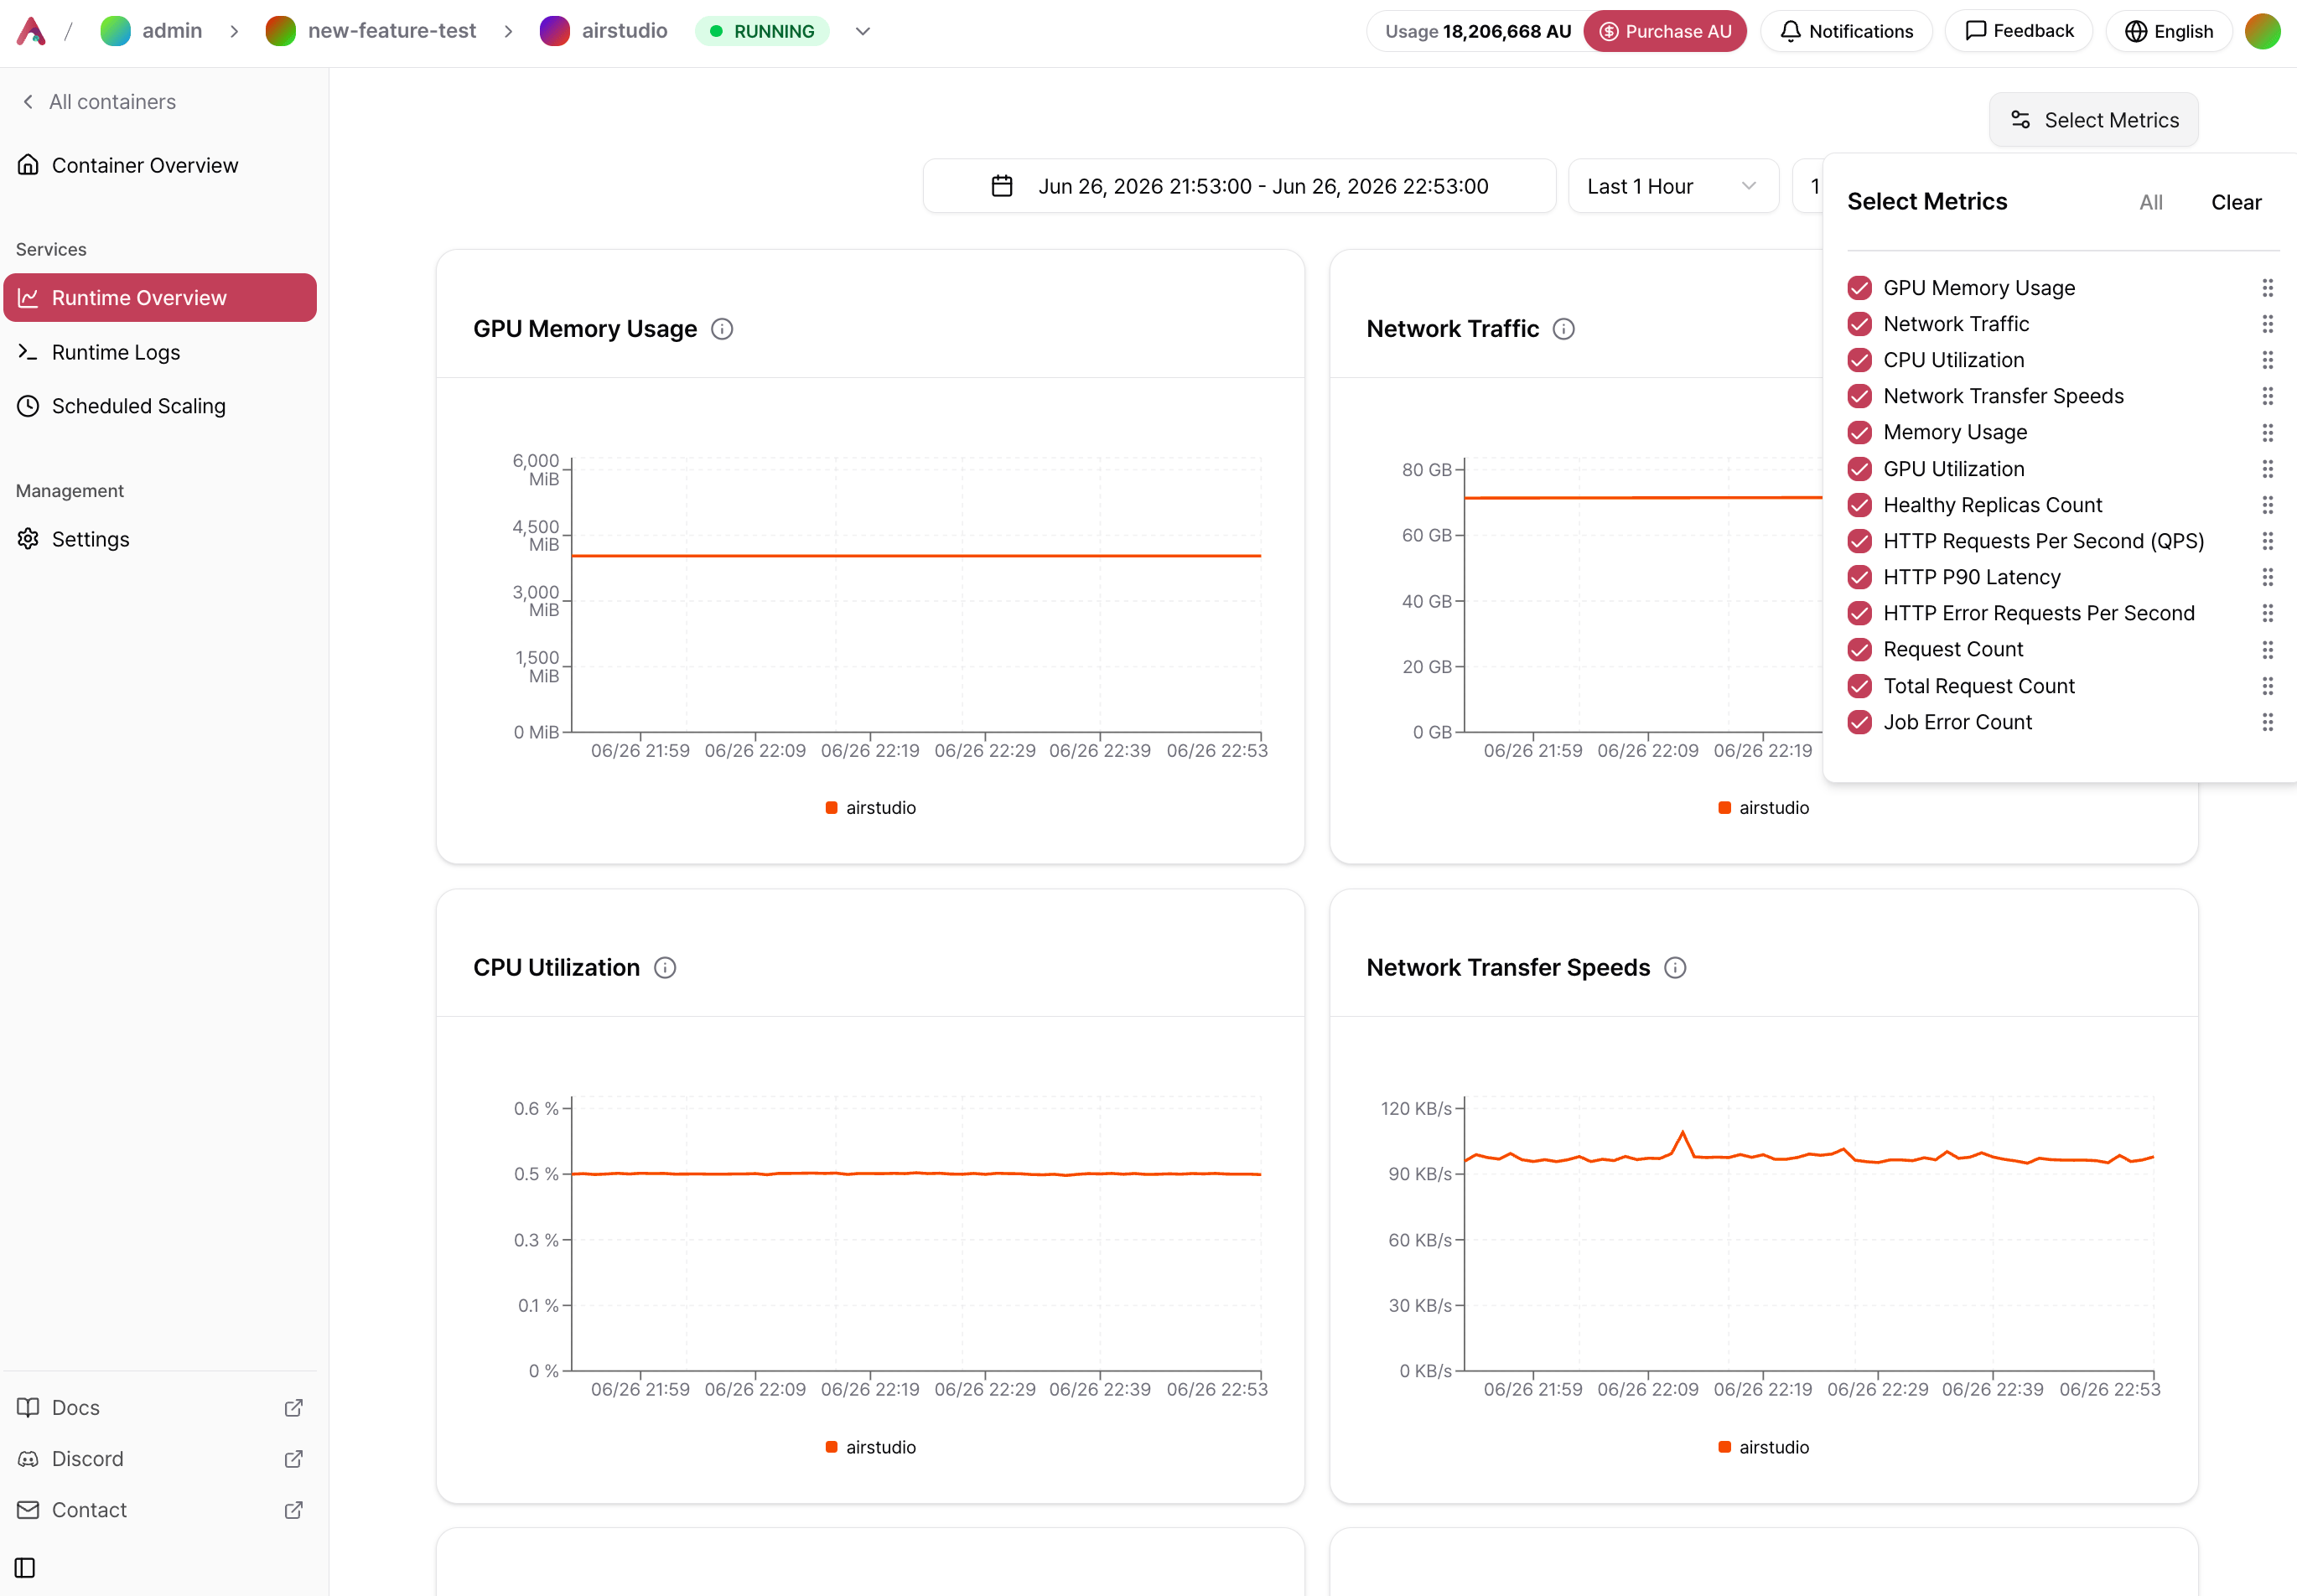
Available Metrics
Replica Timeline
The Healthy Replicas Count card at the top of the container’s monitoring page shows when Autoscaling added or removed Replicas, alongside your other metrics.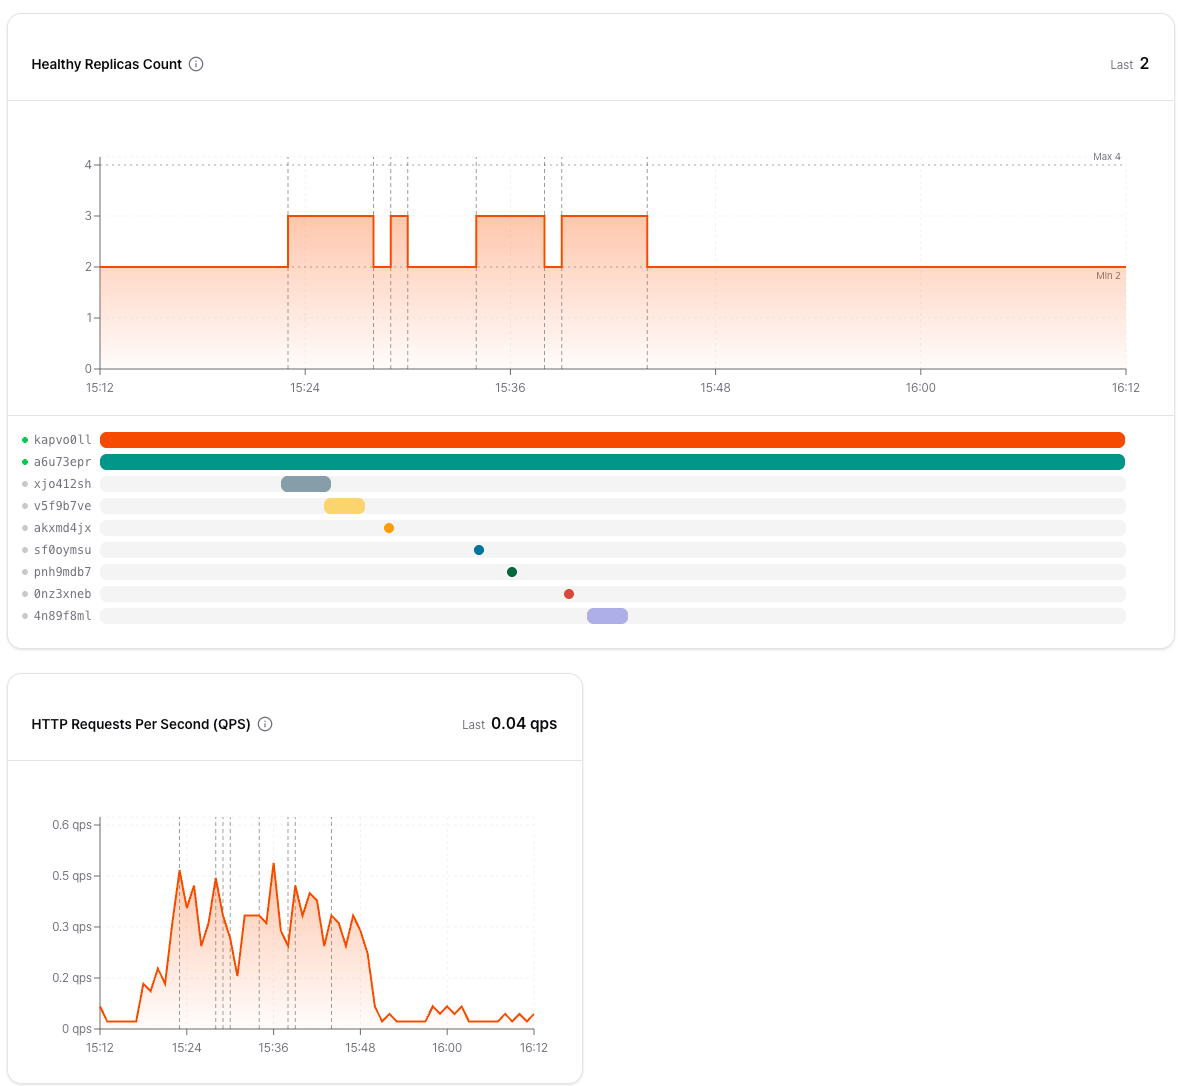
- Replica count and runtime: One card shows how the Replica count changed over the selected range and when each Replica was running. Replicas that ran only briefly appear as dots.
- Min and max guides: The Autoscaling minimum and maximum Replica counts are drawn as dashed lines, so you can see how close you are to the limit. If Autoscaling is off, the card shows the fixed Replica count instead.
- How Replicas are scaled: Hover the ⓘ icon on the card to see the scaling rule. With Autoscaling on, a Replica is added when each Replica is handling more than the target number of concurrent requests on average, and removed when the load drops. With Autoscaling off, a change in the Replica count may mean a restart or a failure.
- Scale markers: Every metric chart marks the moments the Replica count changed with a vertical dashed line, so you can compare how requests, latency, GPU utilization, and other metrics changed before and after each scale event.
Autoscaling decides only from the number of concurrent requests per Replica. The scale markers help you compare metrics before and after a scale event; they do not mean that the metric on that chart caused it.
Drag to Zoom
Drag across any chart to zoom every chart on the page into that range. The data is re-queried at a finer interval for the zoomed range. Click Reset zoom to return to the previous range.Container Runtime Logs
From the Runtime Logs page of a container, you can view logs for both running and terminated Replicas.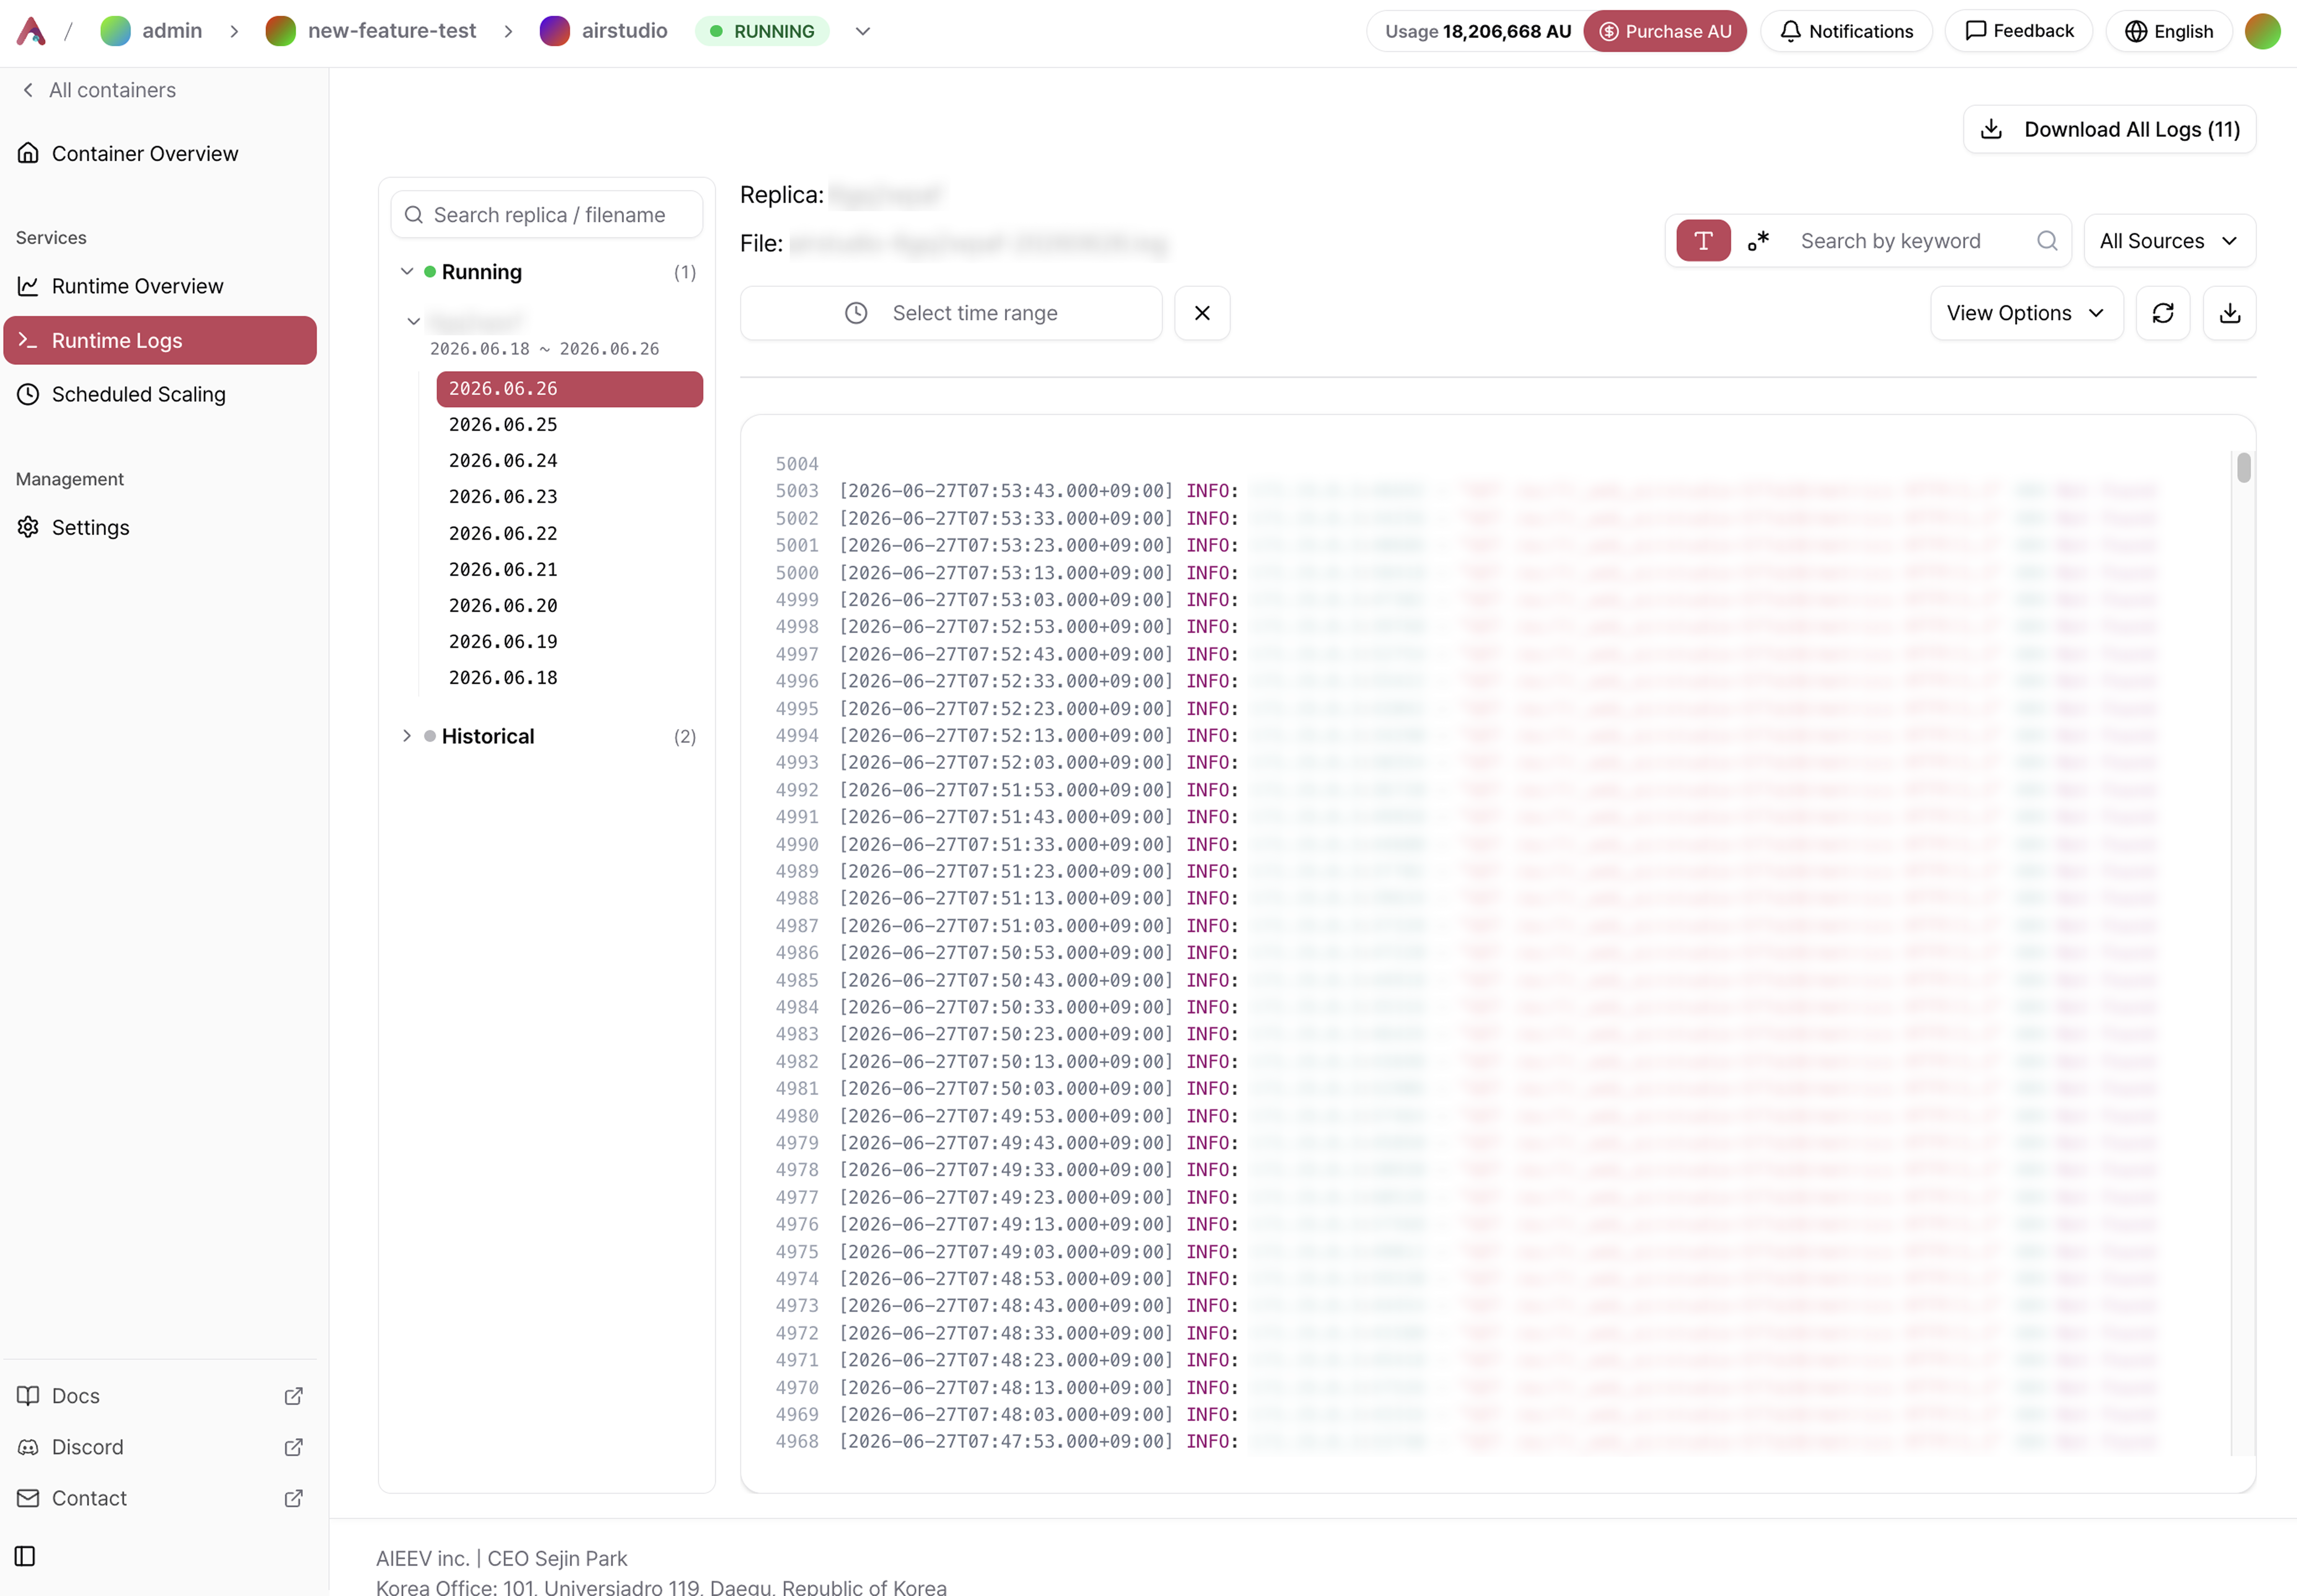
- Logs from both running and stopped Replicas remain viewable.
- Jump to latest returns to the newest lines after scrolling back.
- Download saves the selected Replica’s logs, and Download all saves every Replica’s logs at once.
If a deployment fails or behaves unexpectedly, checking the runtime logs is usually the fastest way to identify the cause. Very long logs are truncated in the viewer to the most recent lines — download the file to read the whole thing.
Related Documentation
Troubleshooting
Learn how to diagnose common deployment and operational issues.
Autoscaling and Scheduled Scaling
Learn how Replica counts change with Autoscaling and Scheduled Scaling.