

AirCloud provides two levels of monitoring for Air API: Project-level Monitoring and Organization-level Usage.
Use Project Monitoring to analyze API requests and performance, and Organization Usage to track spending trends across projects over time.

Project Monitoring

From the Project sidebar, navigate to Monitoring and select the Air API tab to view API request metrics and spending for the current project over time. Project Monitoring Eng
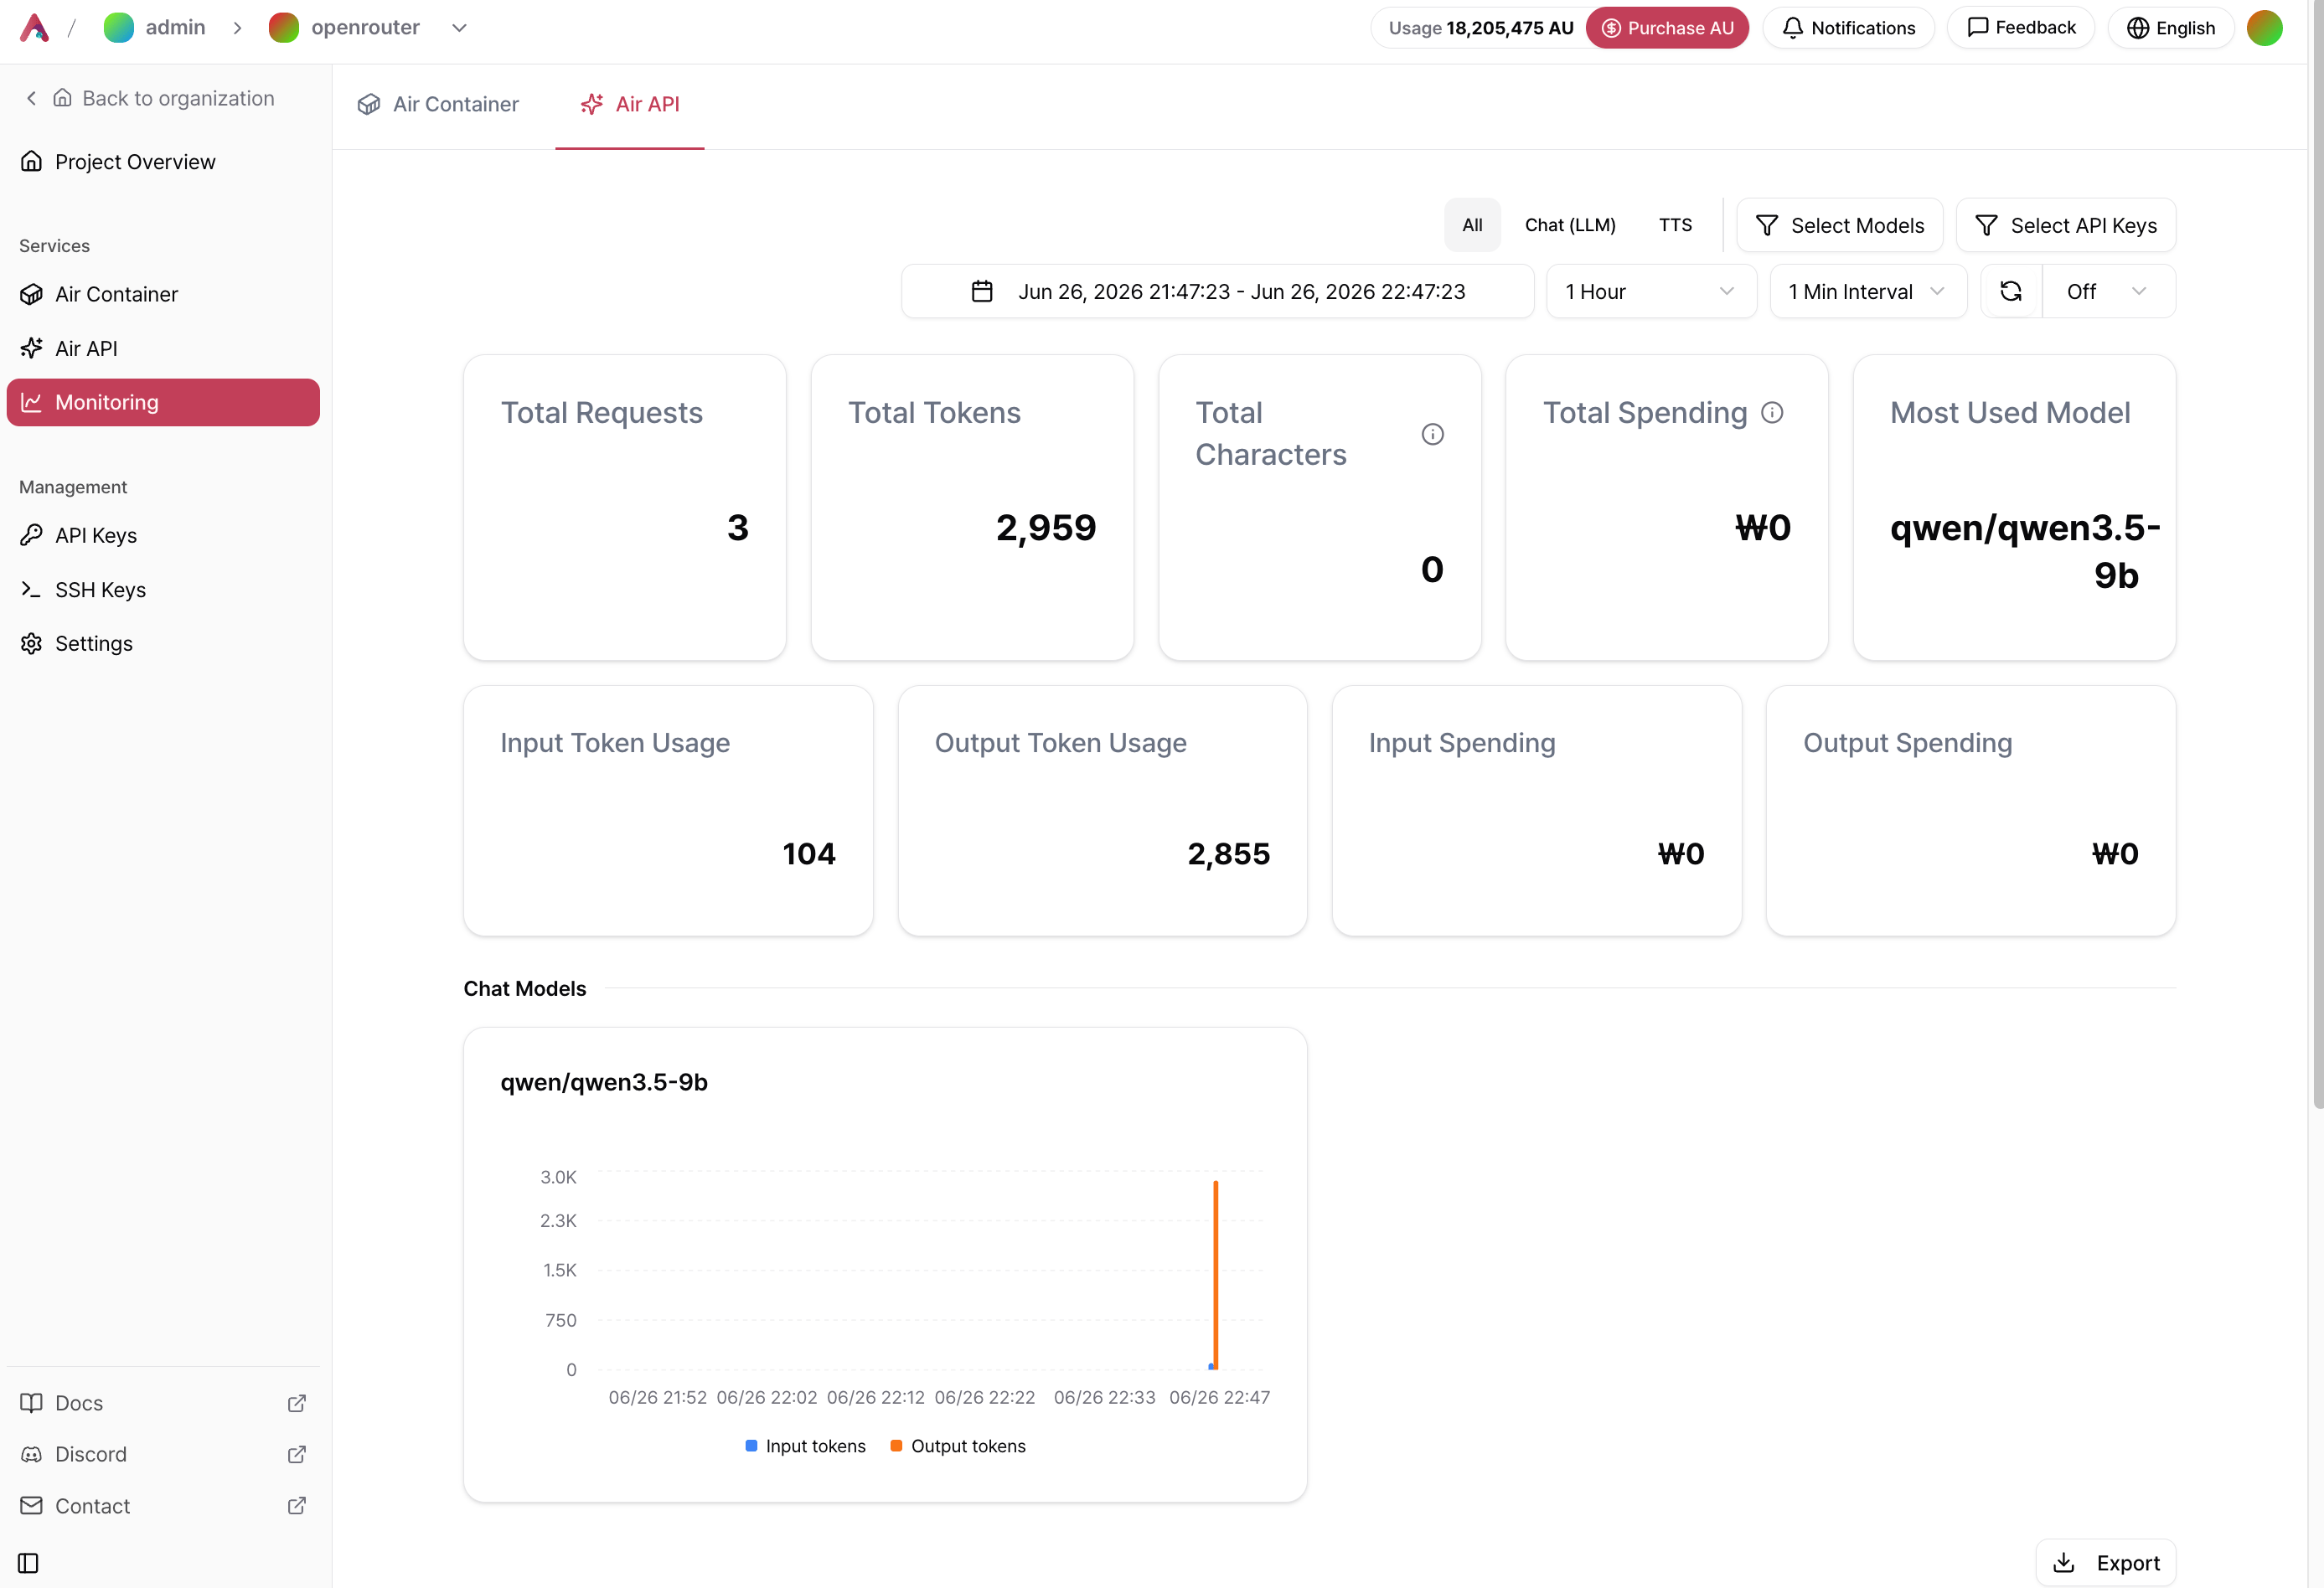
Metrics

MetricDescription
Total RequestsTotal number of API requests during the selected period.
Total TokensSum of input and output tokens.
Total CharactersTotal characters processed by character-based models such as TTS.
Total CostTotal spending during the selected period (AU).
Most Used ModelThe model with the highest number of requests.
Input TokensTotal number of input tokens.
Output TokensTotal number of output tokens.
Input CostCost incurred by input tokens.
Output CostCost incurred by output tokens.

Filter Options

Project Monitoring Filter
OptionDescription
Service TypeFilter by All, Chat (LLM), or TTS.
ModelView requests for a specific model only.
API KeyView requests made using a specific API key.
Date RangeSelect the time range to analyze.
Time IntervalChoose the aggregation interval (for example, 1 minute or 5 minutes).
Auto RefreshEnable or disable automatic updates.

Request History

Individual API requests are displayed in a table below the metrics. Click Export to download the request history. Export Eng329

FieldDescription
Created AtTime when the request was made.
API KeyAPI key used for the request.
ModelModel used for the request.
Engine TypeRequest type, such as Chat (LLM) or TTS.
UsageNumber of tokens or characters processed.
LatencyTime taken to process the request.

Organization Usage

From the Organization page, navigate to Usage ManagementUsage, then select the Air API filter to view Air API spending across all Projects within the Organization. The table below provides a daily spending breakdown for each Project. Org Usage Eng392
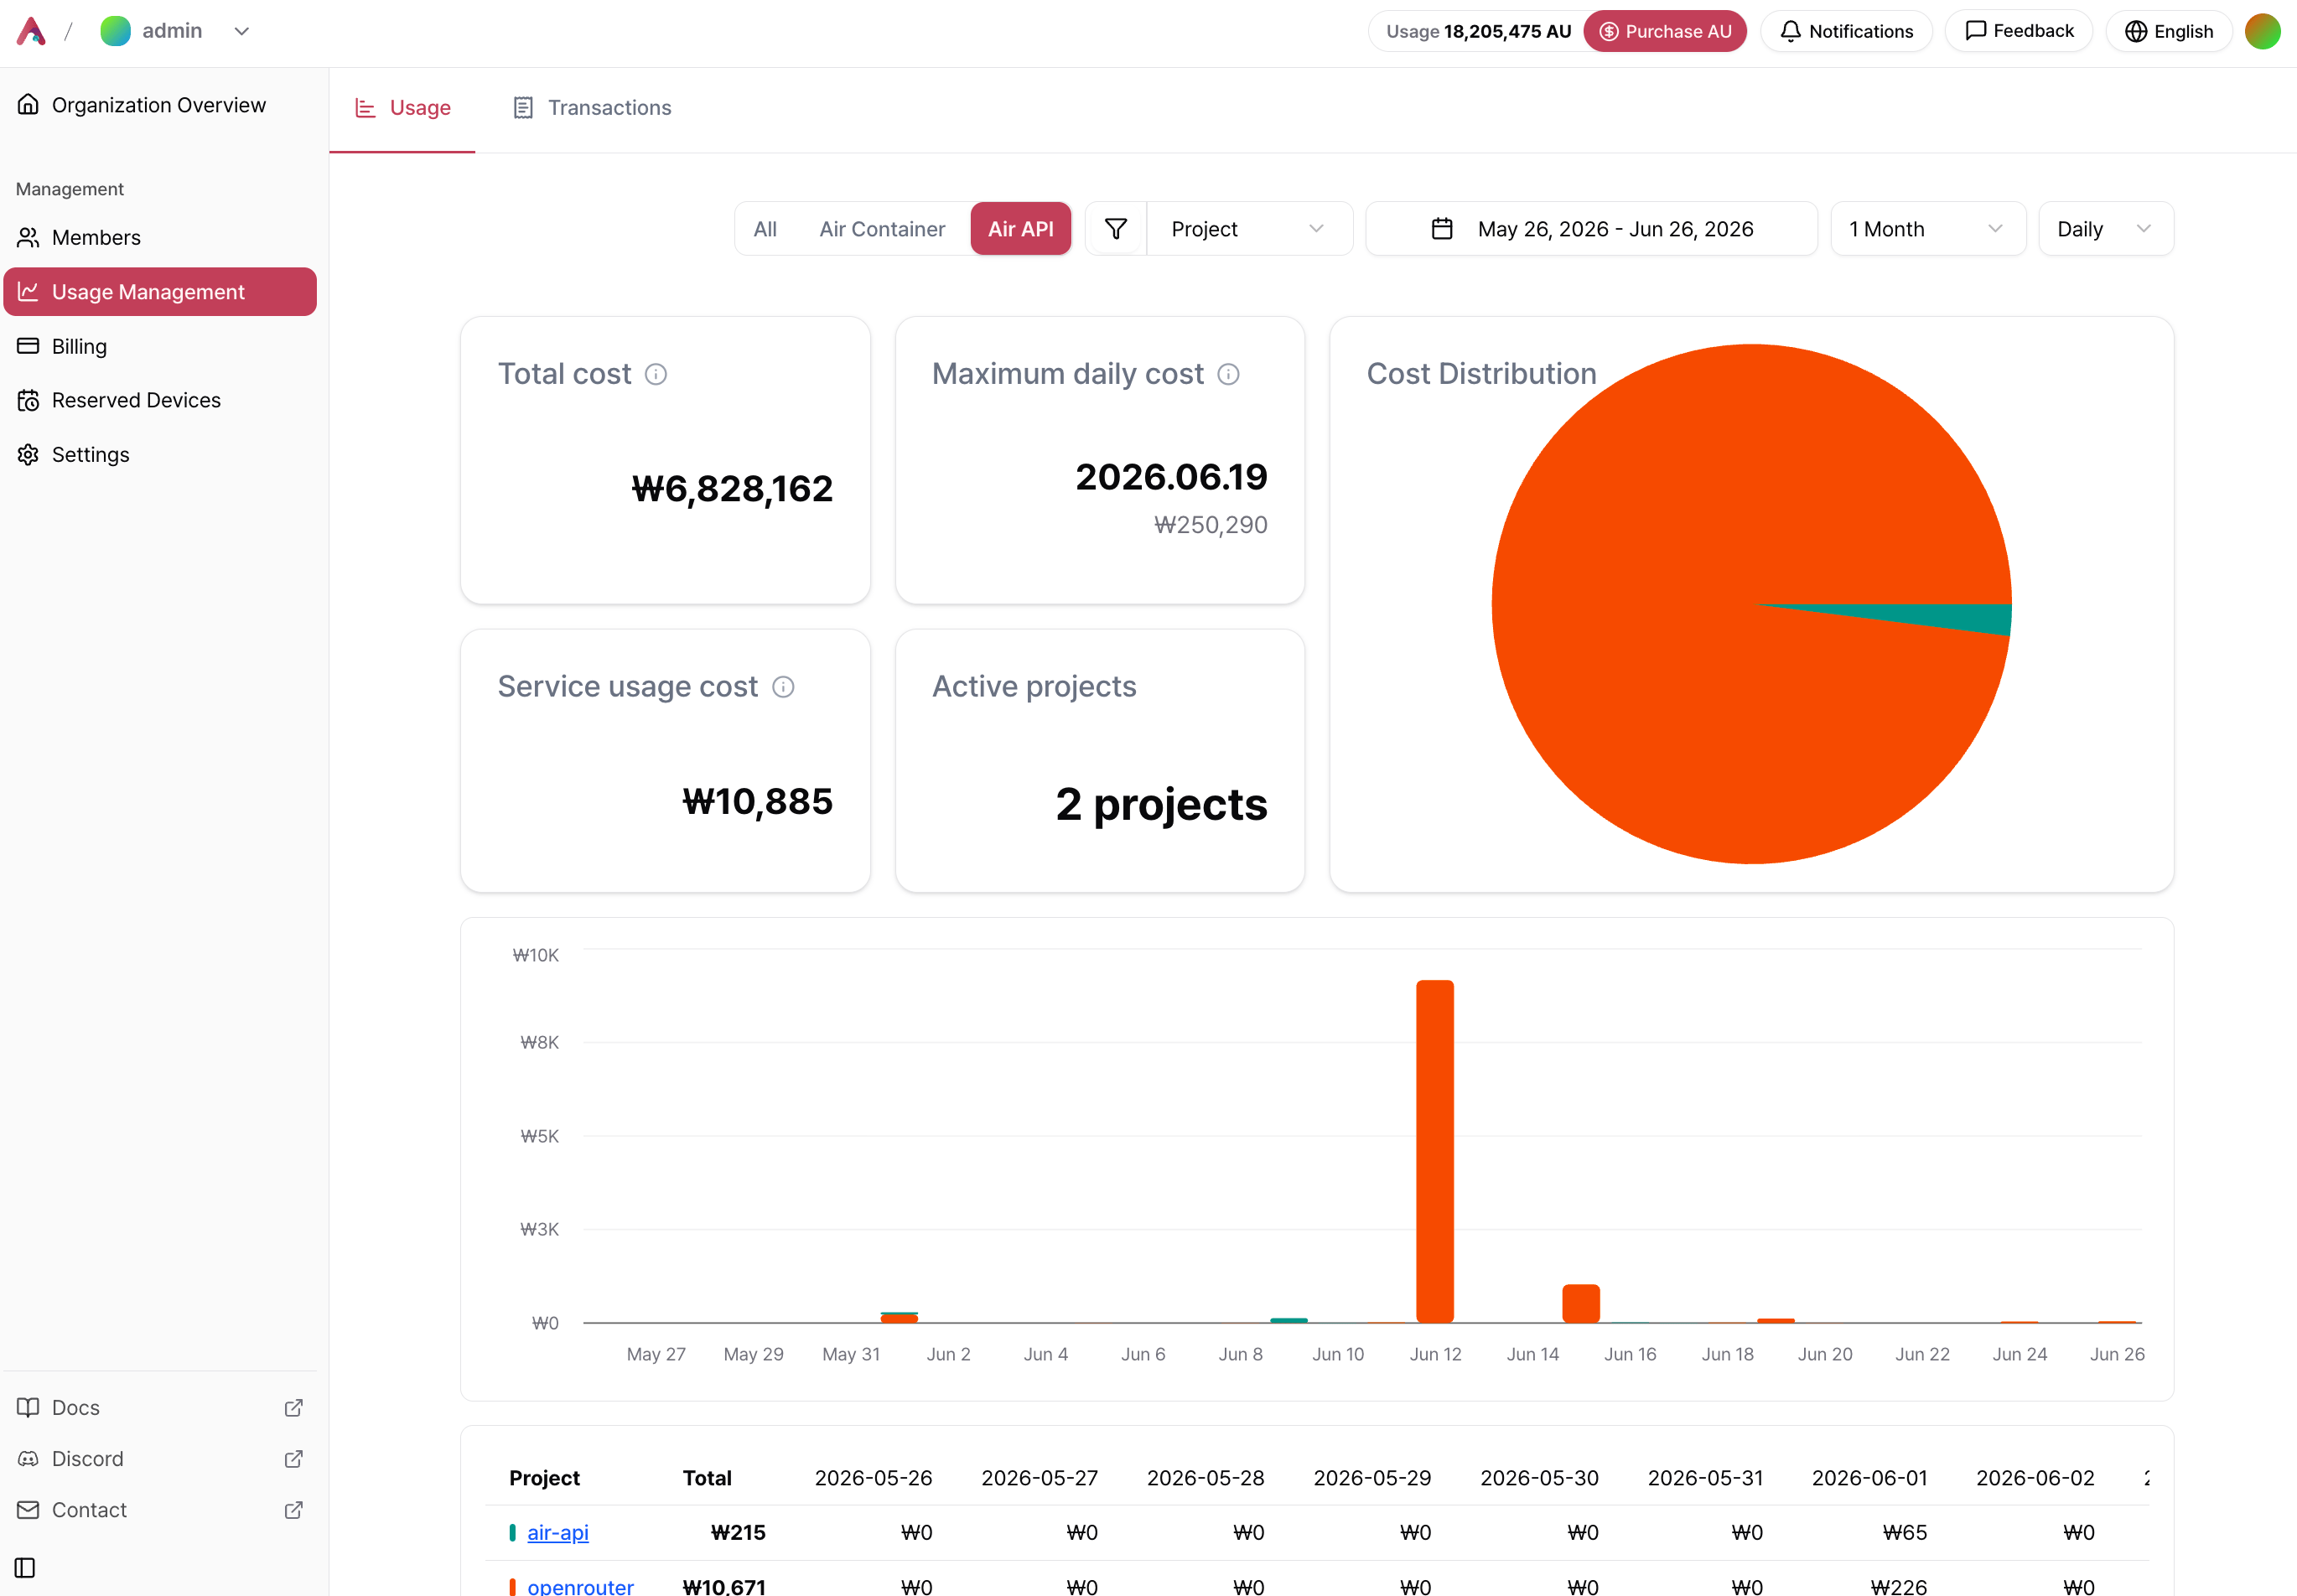
Metrics

MetricDescription
Total CostTotal Air API spending during the selected period.
Highest Daily CostThe highest daily spending amount and the corresponding date.
Cost DistributionPie chart showing spending by Project.
Service CostCombined spending for other services, such as Air Container.
Active ProjectsNumber of Projects that made API requests during the selected period.

API Usage Guide

Learn how to authenticate and call Air API.

Billing

Learn about AU-based billing and the refund policy.
