> ## Documentation Index
> Fetch the complete documentation index at: https://docs.aieev.com/llms.txt
> Use this file to discover all available pages before exploring further.
# Monitoring
> Monitor container metrics and runtime logs
AirCloud provides monitoring at two levels: **Project Monitoring** and **Container Monitoring**.
## Project Monitoring
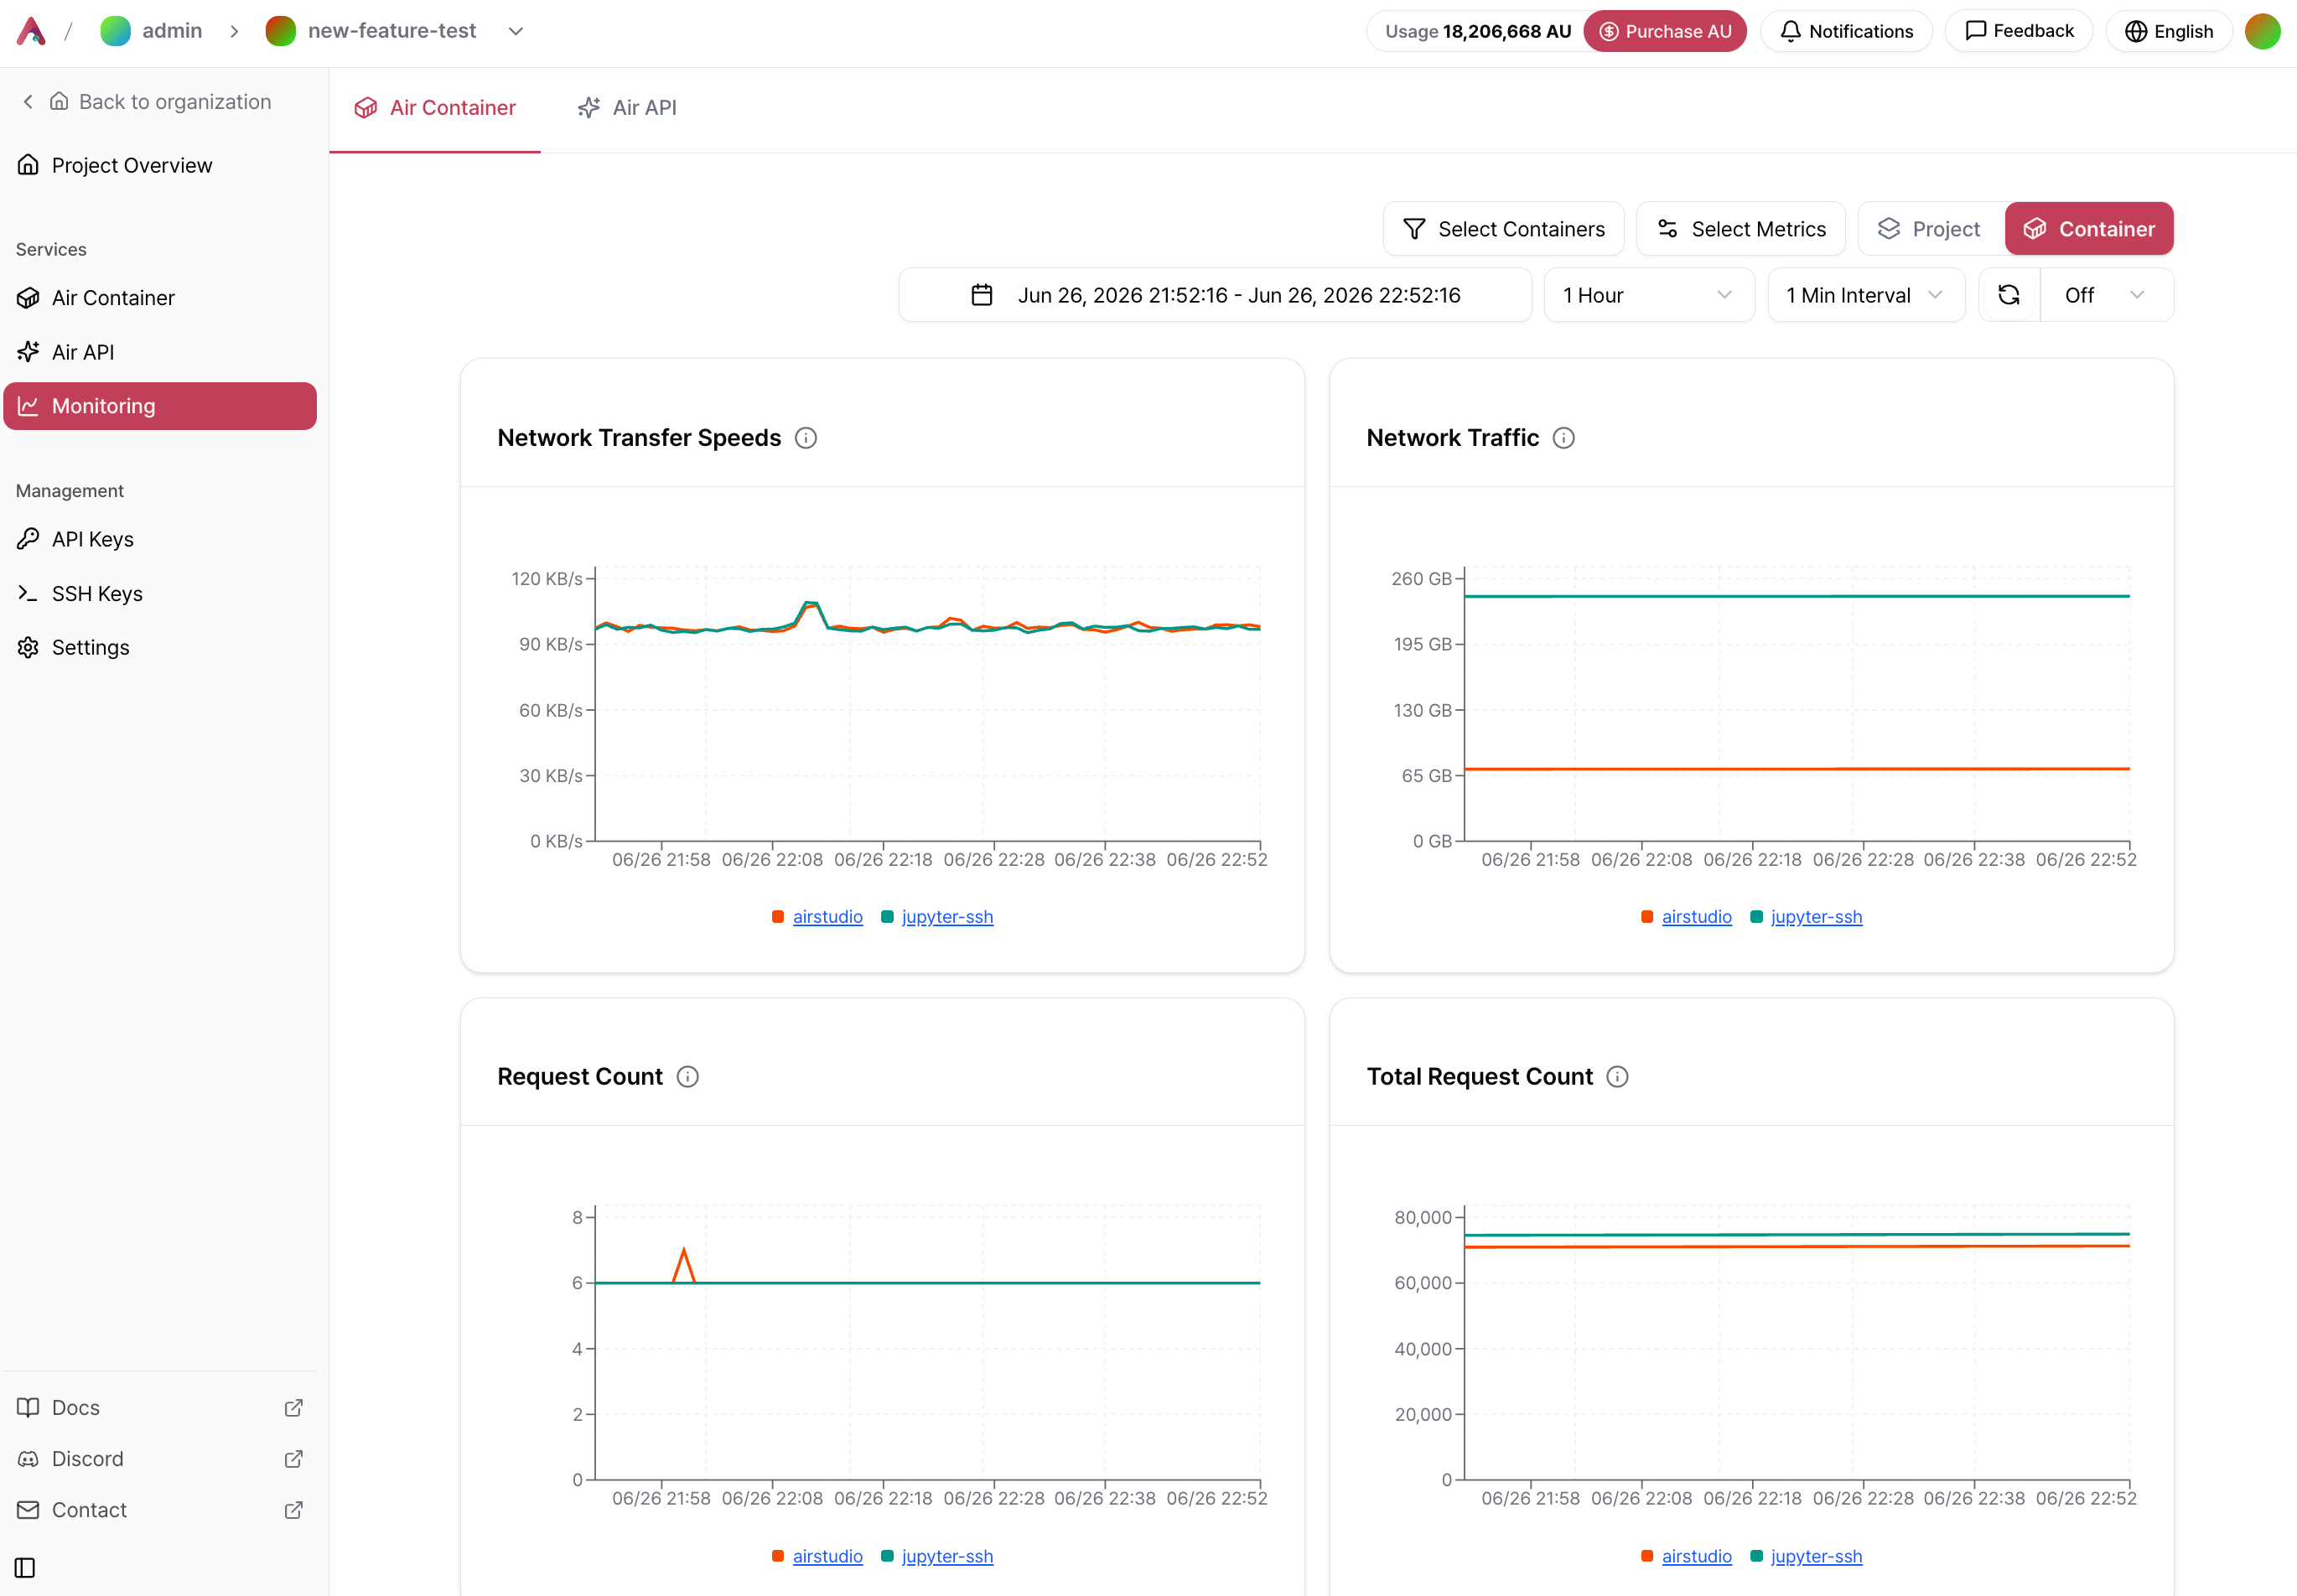
From the Project sidebar, open **Monitoring** to view metrics for all containers within the Project.
If the Project contains multiple containers, their metrics are displayed together on the same chart with separate legends for comparison.
 ### Filters and Display Options
| Option | Description |
| ----------------------- | ----------------------------------------------------------------------------- |
| **Container** | Display metrics for a specific container only. |
| **Metric** | Select the metrics to display. |
| **Project / Container** | Switch between aggregated project metrics and per-container metrics. |
| **Date Range** | Select the time range to view. |
| **Time Interval** | Choose the aggregation interval (for example, **1 minute** or **5 minutes**). |
| **Auto Refresh** | Enable or disable automatic updates. |
## Container Monitoring
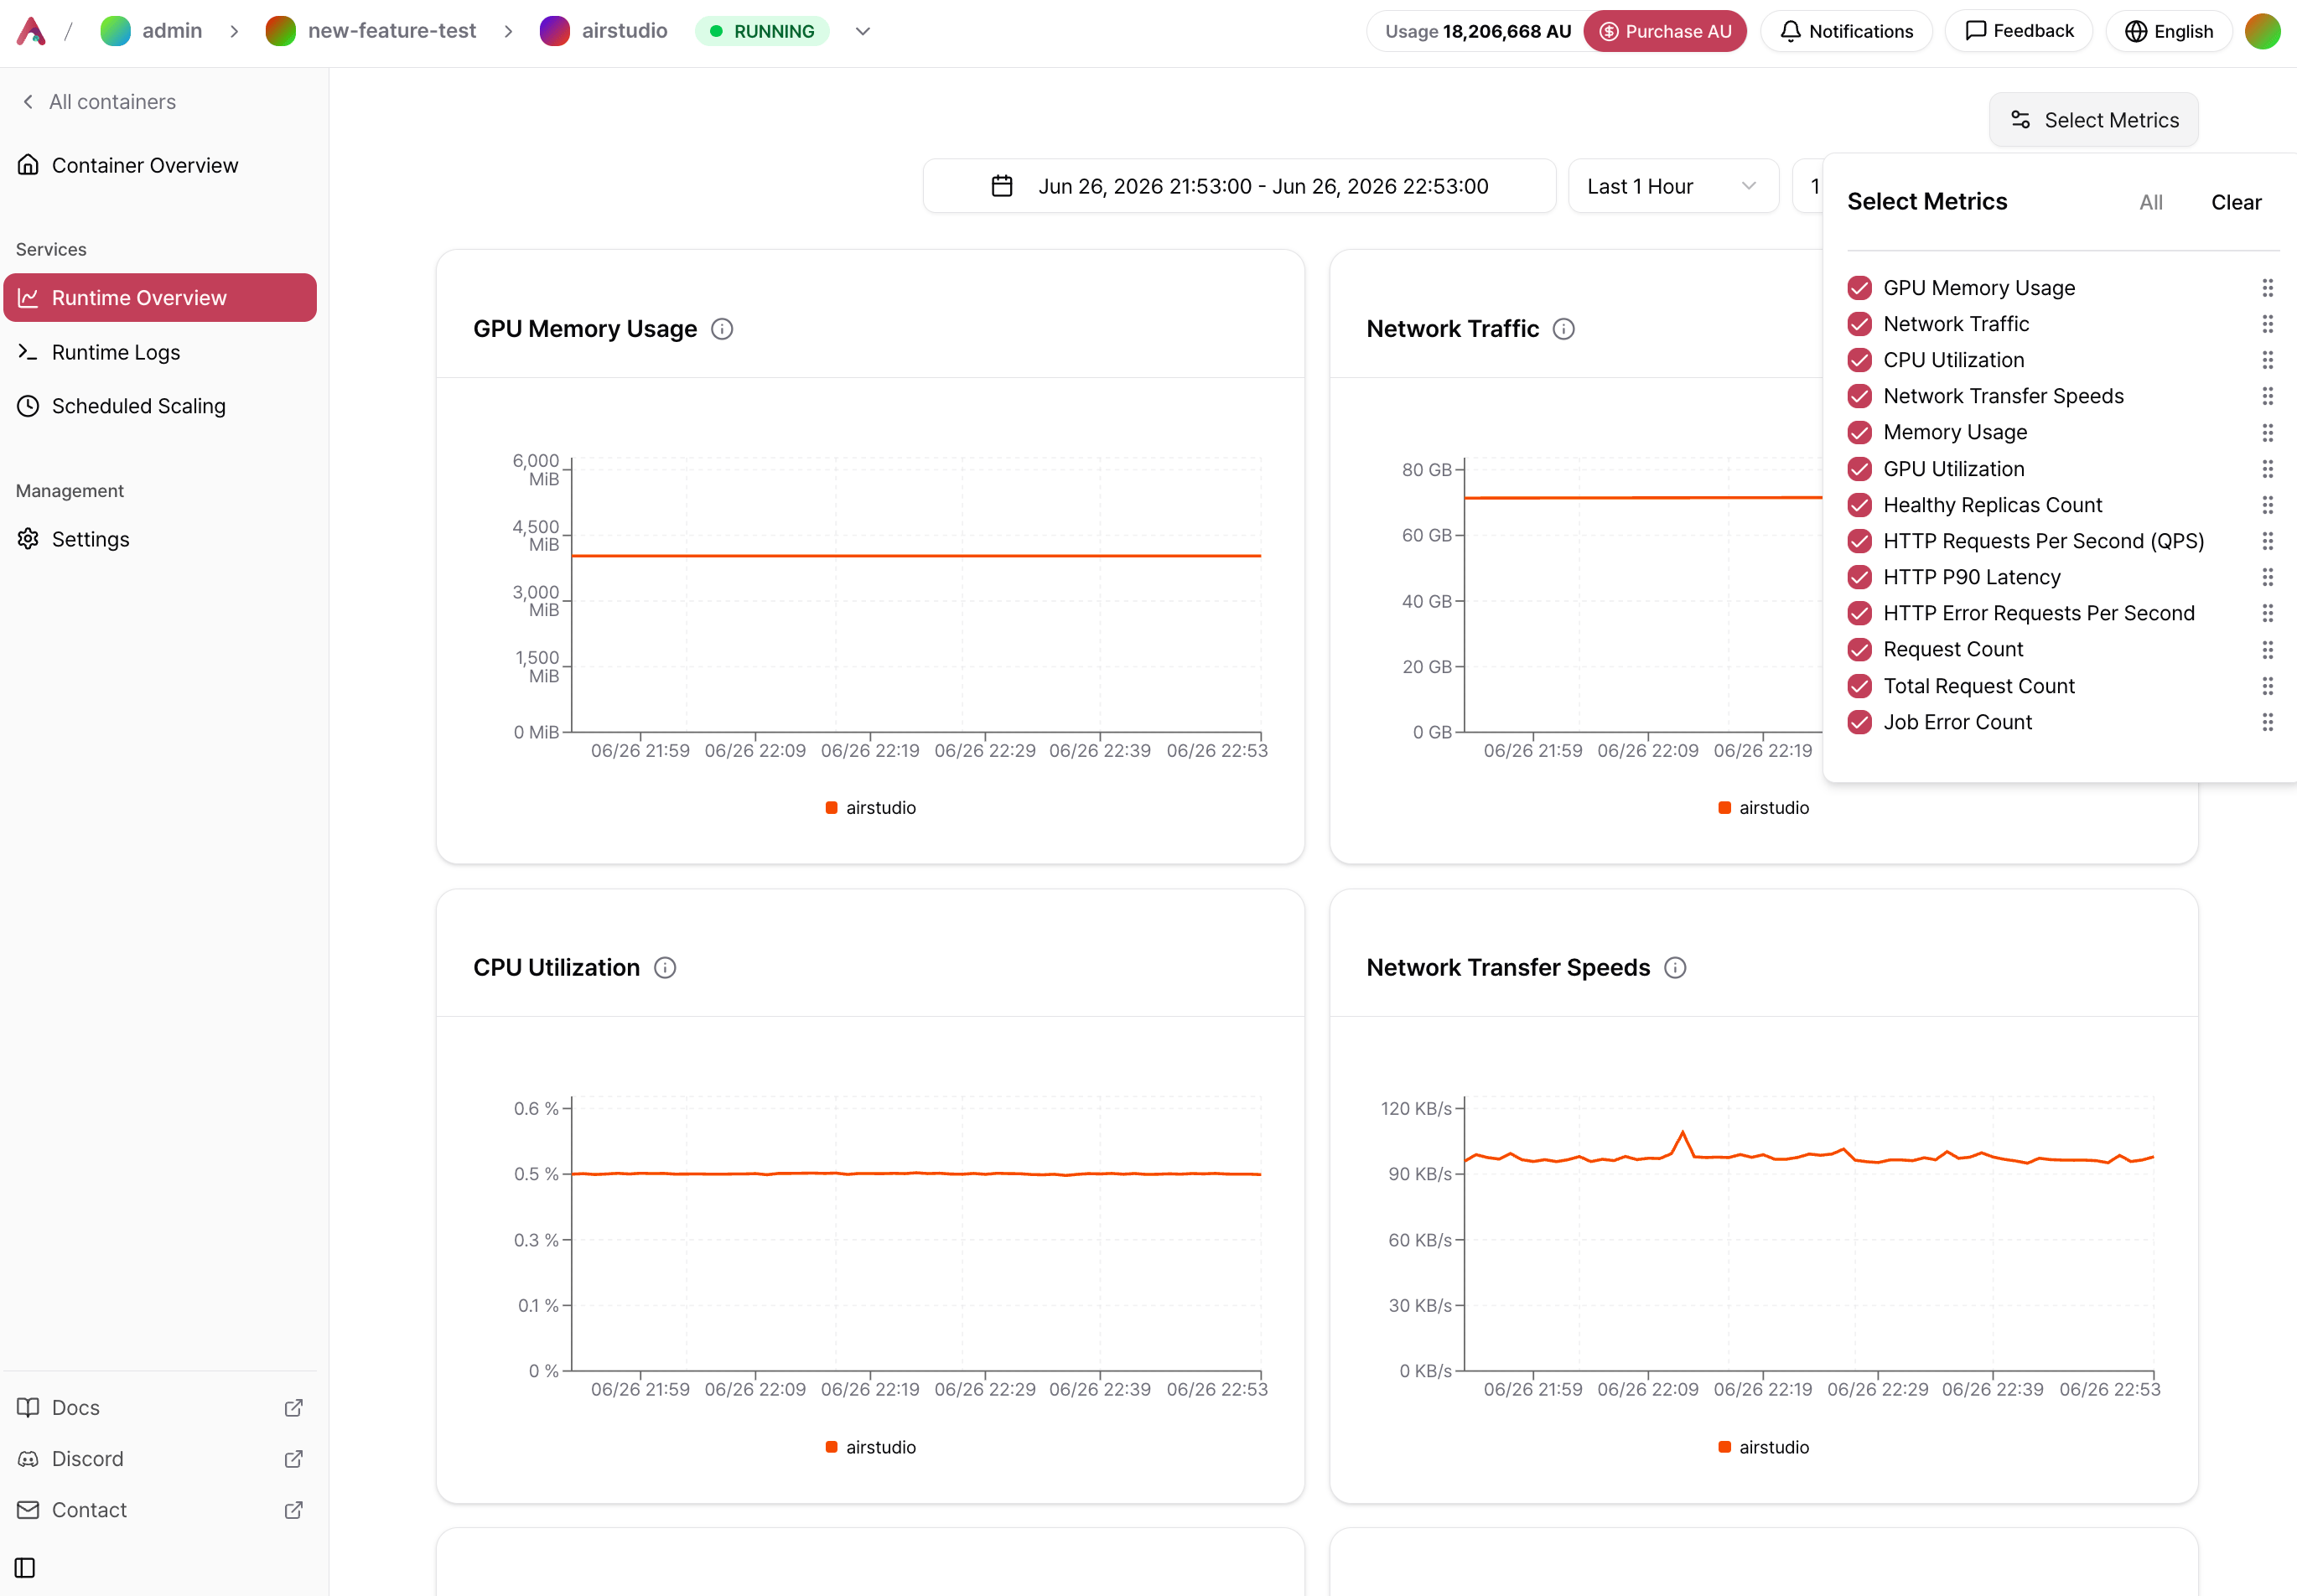
From an individual container page, open **Monitoring** to view detailed metrics for that container.
Use the metric selector in the upper-right corner to customize the dashboard and display only the metrics you need.
### Filters and Display Options
| Option | Description |
| ----------------------- | ----------------------------------------------------------------------------- |
| **Container** | Display metrics for a specific container only. |
| **Metric** | Select the metrics to display. |
| **Project / Container** | Switch between aggregated project metrics and per-container metrics. |
| **Date Range** | Select the time range to view. |
| **Time Interval** | Choose the aggregation interval (for example, **1 minute** or **5 minutes**). |
| **Auto Refresh** | Enable or disable automatic updates. |
## Container Monitoring
From an individual container page, open **Monitoring** to view detailed metrics for that container.
Use the metric selector in the upper-right corner to customize the dashboard and display only the metrics you need.
 ### Available Metrics
| Metric | Description |
| ---------------------------------- | ------------------------------------------------ |
| **GPU Memory Usage** | GPU VRAM usage (MiB). |
| **GPU Utilization** | GPU utilization (%). |
| **CPU Utilization** | CPU utilization (%). |
| **Memory Usage** | System memory usage (GB). |
| **Network Traffic** | Total inbound and outbound network traffic (GB). |
| **Network Throughput** | Real-time network throughput (KB/s). |
| **Active Replicas** | Number of currently running Replicas. |
| **HTTP Requests per Second (QPS)** | Number of HTTP requests processed per second. |
| **HTTP P90 Latency** | 90th percentile HTTP response latency. |
| **HTTP Errors per Second** | Number of HTTP error responses per second. |
| **Request Count** | Number of requests over time. |
| **Total Requests** | Cumulative request count. |
| **Task Errors** | Number of processing errors. |
## Container Runtime Logs
From the **Runtime Logs** page of a container, you can view logs for both running and terminated Replicas, organized by date.
### Available Metrics
| Metric | Description |
| ---------------------------------- | ------------------------------------------------ |
| **GPU Memory Usage** | GPU VRAM usage (MiB). |
| **GPU Utilization** | GPU utilization (%). |
| **CPU Utilization** | CPU utilization (%). |
| **Memory Usage** | System memory usage (GB). |
| **Network Traffic** | Total inbound and outbound network traffic (GB). |
| **Network Throughput** | Real-time network throughput (KB/s). |
| **Active Replicas** | Number of currently running Replicas. |
| **HTTP Requests per Second (QPS)** | Number of HTTP requests processed per second. |
| **HTTP P90 Latency** | 90th percentile HTTP response latency. |
| **HTTP Errors per Second** | Number of HTTP error responses per second. |
| **Request Count** | Number of requests over time. |
| **Total Requests** | Cumulative request count. |
| **Task Errors** | Number of processing errors. |
## Container Runtime Logs
From the **Runtime Logs** page of a container, you can view logs for both running and terminated Replicas, organized by date.
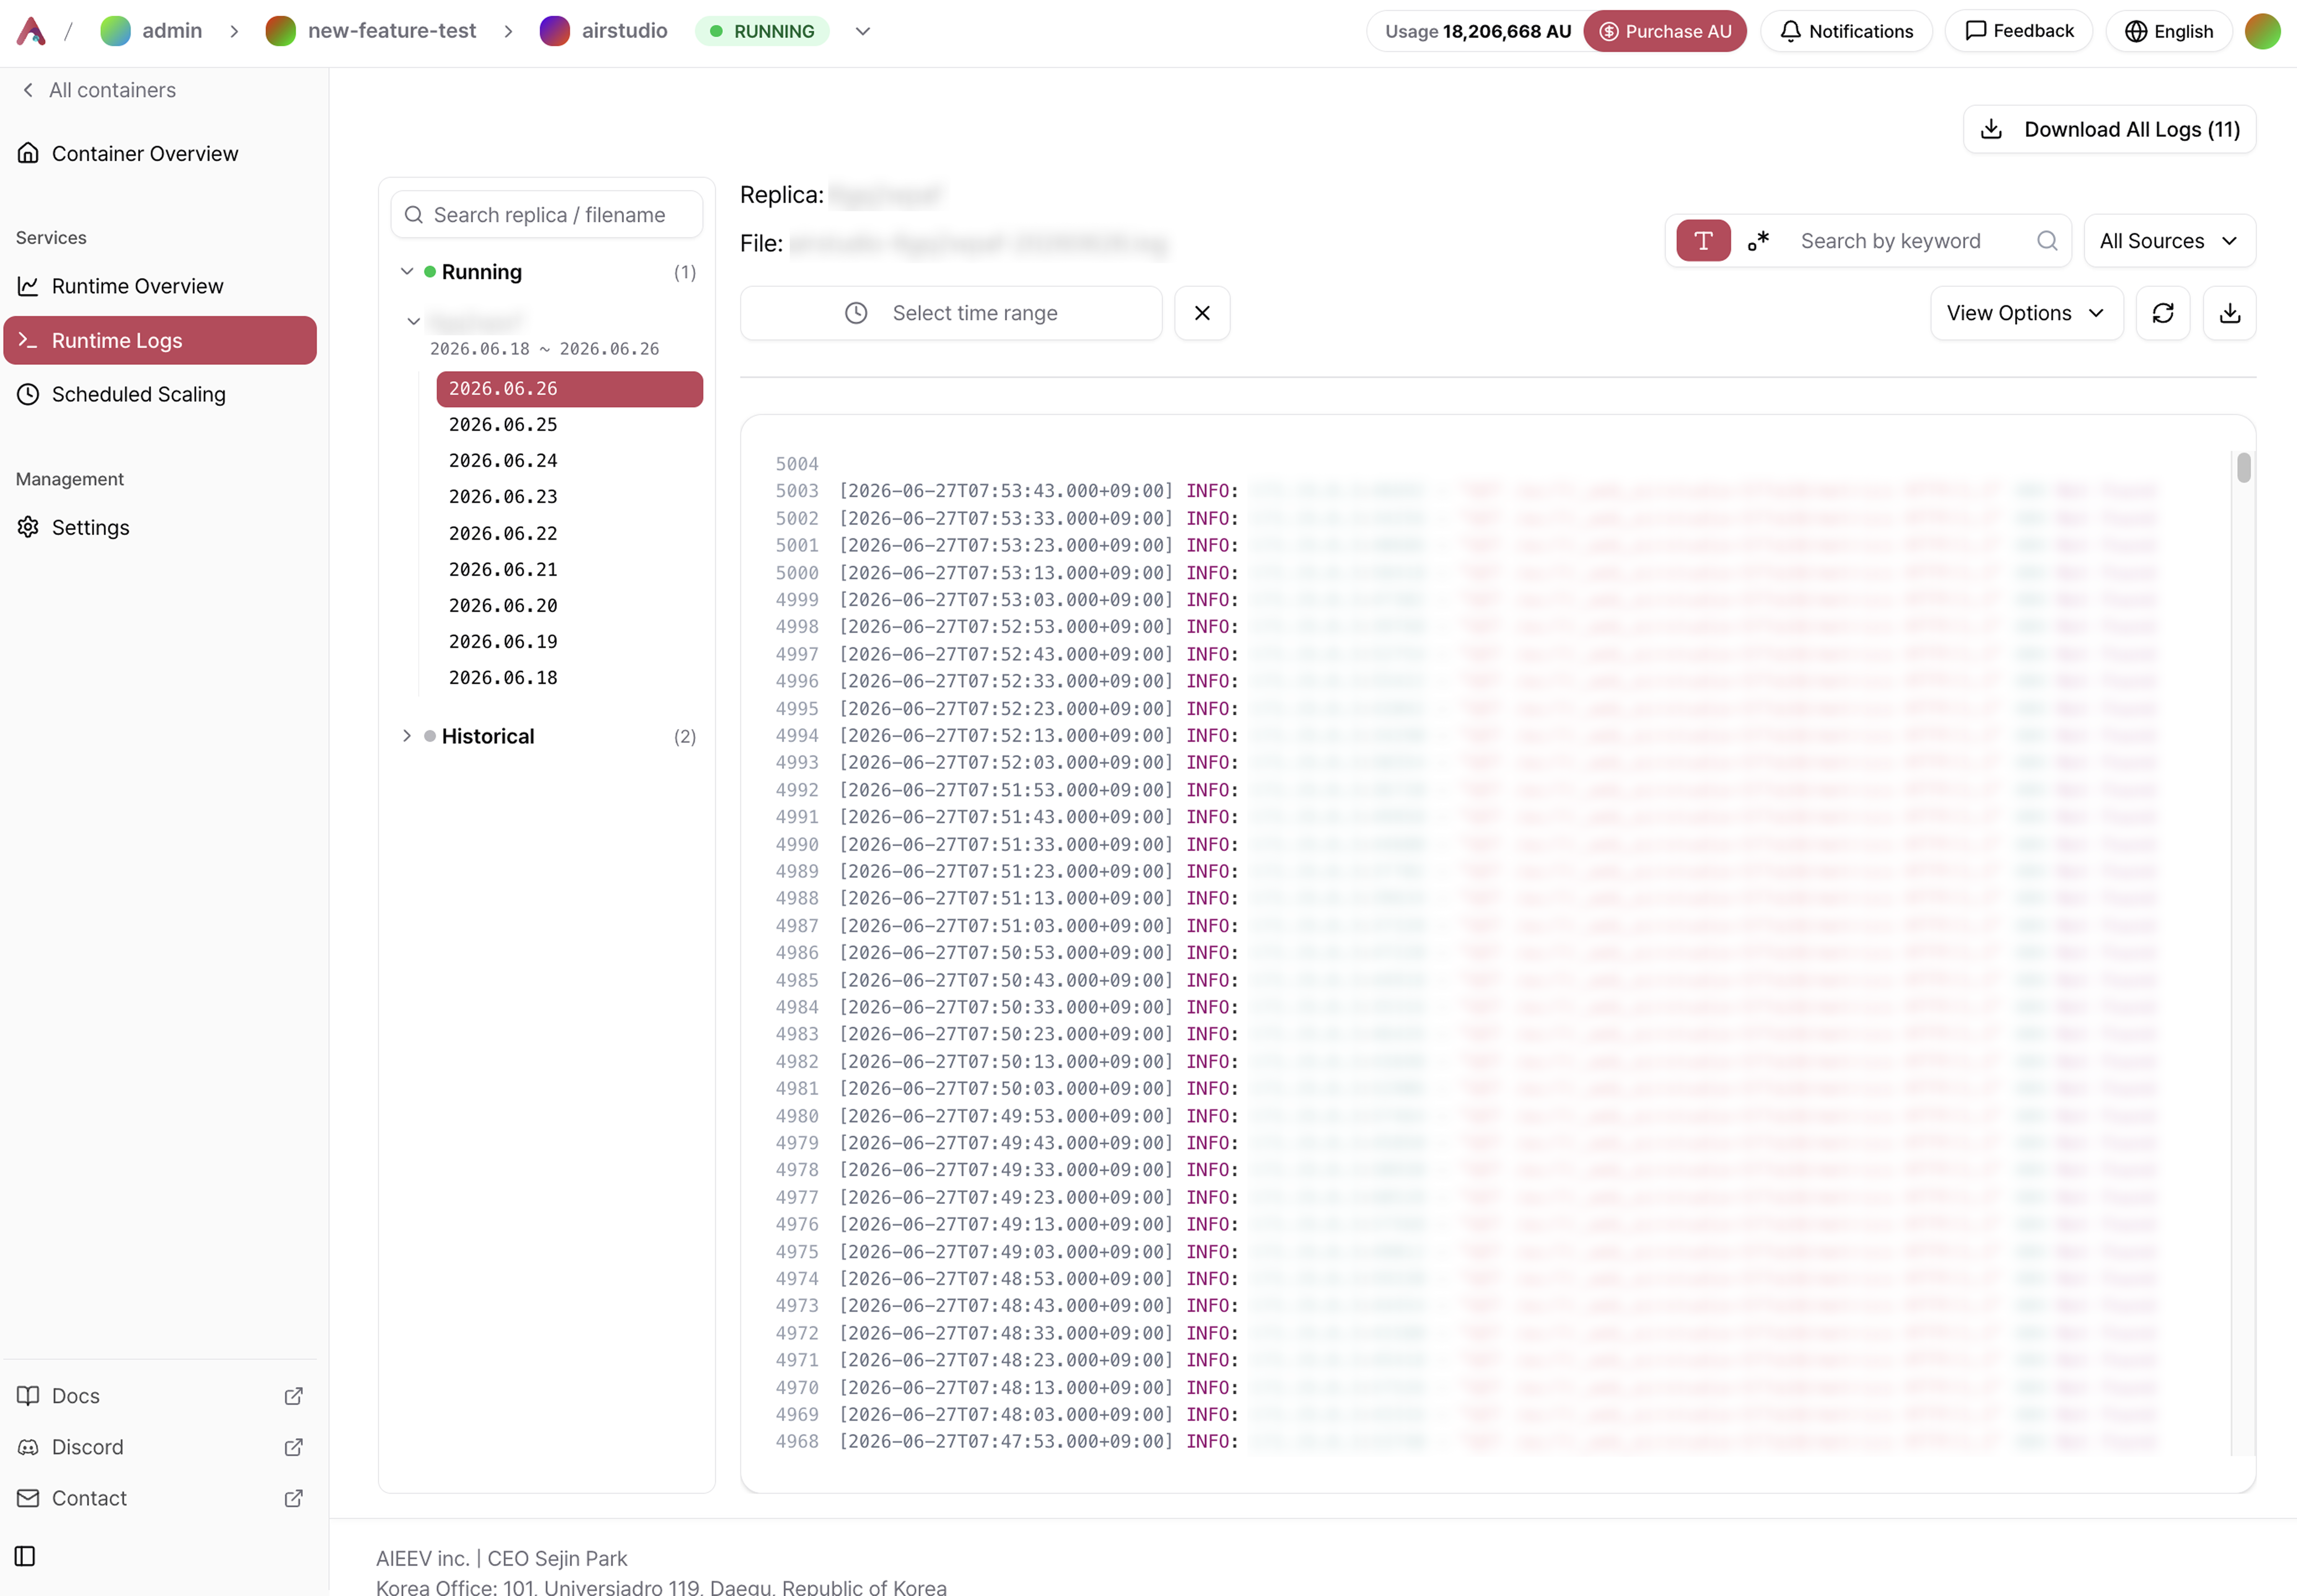 Select a Replica and log file from the left panel to display its contents.
| Filter | Description |
| ------------------------- | ------------------------------------------------------------ |
| **Replica / File Search** | Quickly find a specific Replica or log file. |
| **Time Range** | Display logs within a specific time range. |
| **Keyword Search** | Search log contents using plain text or regular expressions. |
| **Source Filter** | Display logs from all sources or only selected sources. |
| **View Options** | Customize how logs are displayed. |
* View logs from both **Running** and **Terminated** Replicas.
* Browse log files organized by date.
* Click **Download All Logs** to download all available log files.
If a deployment fails or behaves unexpectedly, checking the runtime logs is usually the fastest way to identify the cause. Runtime logs are retained for a period of time even after a container has stopped.
## Related Documentation
Learn how to diagnose common deployment and operational issues.
Learn how Replica counts change with Autoscaling and Scheduled Scaling.
Select a Replica and log file from the left panel to display its contents.
| Filter | Description |
| ------------------------- | ------------------------------------------------------------ |
| **Replica / File Search** | Quickly find a specific Replica or log file. |
| **Time Range** | Display logs within a specific time range. |
| **Keyword Search** | Search log contents using plain text or regular expressions. |
| **Source Filter** | Display logs from all sources or only selected sources. |
| **View Options** | Customize how logs are displayed. |
* View logs from both **Running** and **Terminated** Replicas.
* Browse log files organized by date.
* Click **Download All Logs** to download all available log files.
If a deployment fails or behaves unexpectedly, checking the runtime logs is usually the fastest way to identify the cause. Runtime logs are retained for a period of time even after a container has stopped.
## Related Documentation
Learn how to diagnose common deployment and operational issues.
Learn how Replica counts change with Autoscaling and Scheduled Scaling.