> ## Documentation Index
> Fetch the complete documentation index at: https://docs.aieev.com/llms.txt
> Use this file to discover all available pages before exploring further.
# Monitoring
> Monitor Air API requests, usage, and spending
AirCloud provides two levels of monitoring for Air API: **Project-level Monitoring** and **Organization-level Usage**.
Use **Project Monitoring** to analyze API requests and performance, and **Organization Usage** to track spending trends across projects over time.
## Project Monitoring
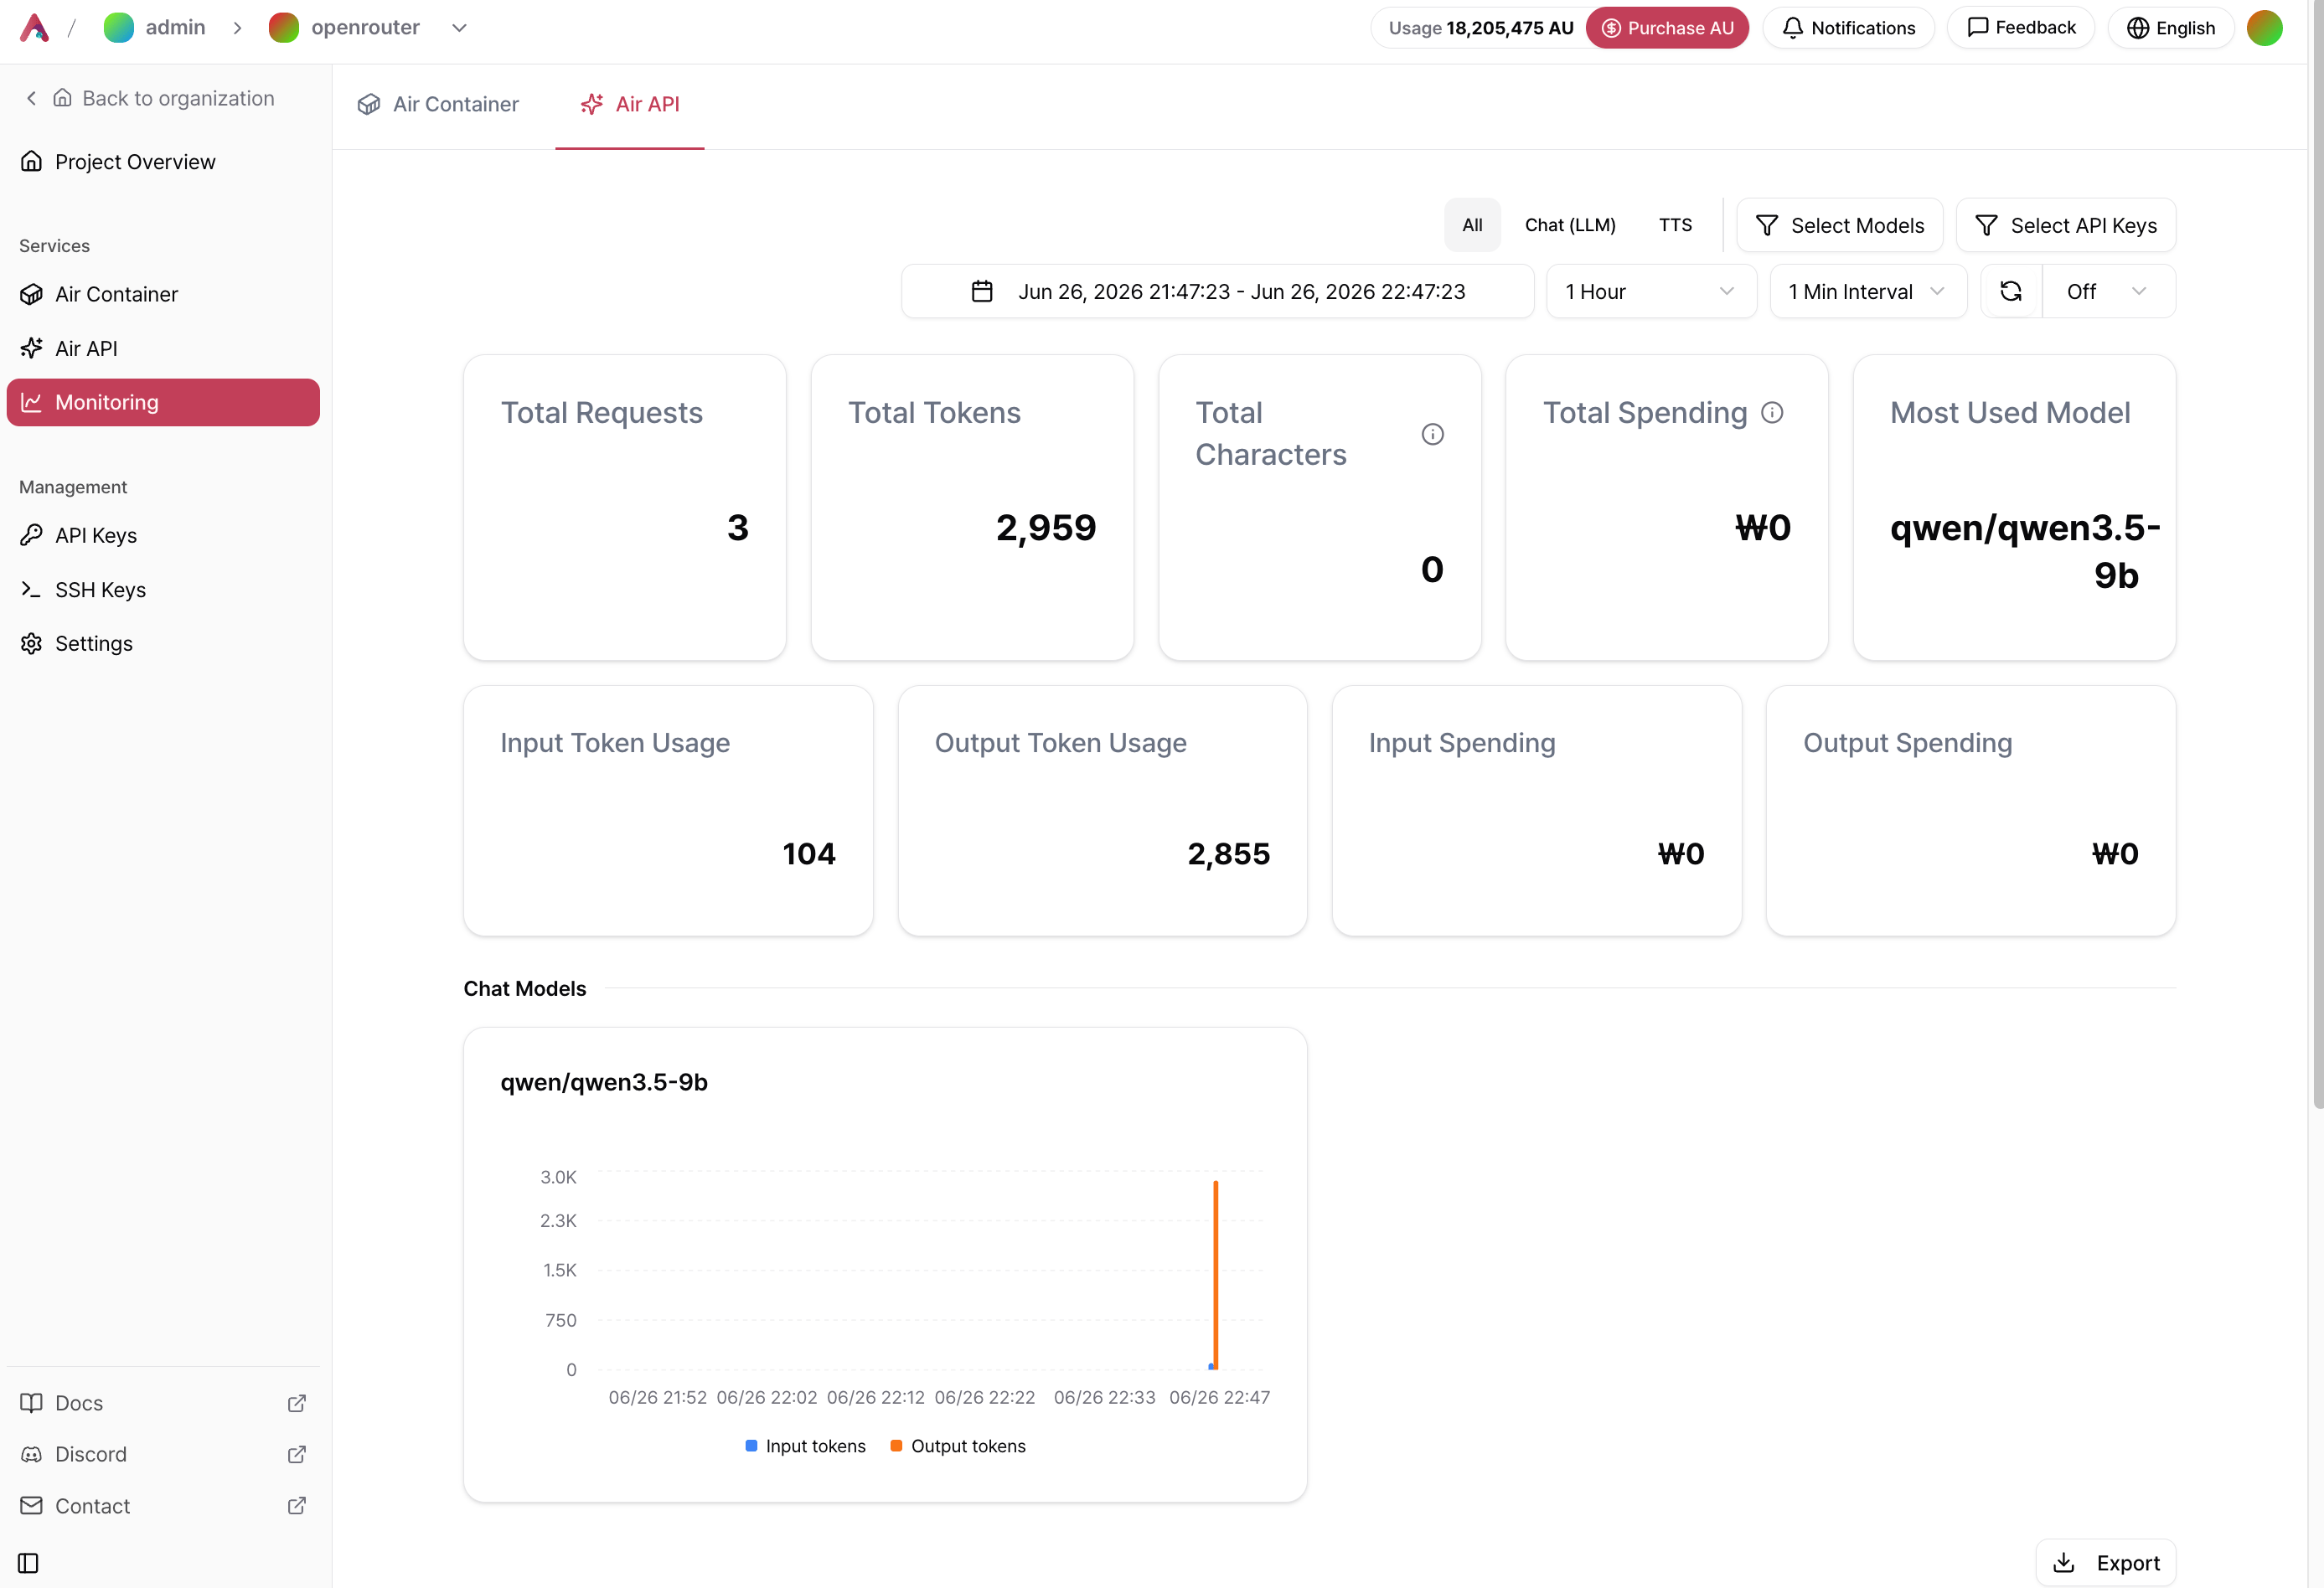
From the Project sidebar, navigate to **Monitoring** and select the **Air API** tab to view API request metrics and spending for the current project over time.
 ### Metrics
| Metric | Description |
| -------------------- | ----------------------------------------------------------------- |
| **Total Requests** | Total number of API requests during the selected period. |
| **Total Tokens** | Sum of input and output tokens. |
| **Total Characters** | Total characters processed by character-based models such as TTS. |
| **Total Cost** | Total spending during the selected period (AU). |
| **Most Used Model** | The model with the highest number of requests. |
| **Input Tokens** | Total number of input tokens. |
| **Output Tokens** | Total number of output tokens. |
| **Input Cost** | Cost incurred by input tokens. |
| **Output Cost** | Cost incurred by output tokens. |
### Filter Options
### Metrics
| Metric | Description |
| -------------------- | ----------------------------------------------------------------- |
| **Total Requests** | Total number of API requests during the selected period. |
| **Total Tokens** | Sum of input and output tokens. |
| **Total Characters** | Total characters processed by character-based models such as TTS. |
| **Total Cost** | Total spending during the selected period (AU). |
| **Most Used Model** | The model with the highest number of requests. |
| **Input Tokens** | Total number of input tokens. |
| **Output Tokens** | Total number of output tokens. |
| **Input Cost** | Cost incurred by input tokens. |
| **Output Cost** | Cost incurred by output tokens. |
### Filter Options
 | Option | Description |
| ----------------- | ----------------------------------------------------------------------------- |
| **Service Type** | Filter by **All**, **Chat (LLM)**, or **TTS**. |
| **Model** | View requests for a specific model only. |
| **API Key** | View requests made using a specific API key. |
| **Date Range** | Select the time range to analyze. |
| **Time Interval** | Choose the aggregation interval (for example, **1 minute** or **5 minutes**). |
| **Auto Refresh** | Enable or disable automatic updates. |
### Request History
Individual API requests are displayed in a table below the metrics.
Click **Export** to download the request history.
| Option | Description |
| ----------------- | ----------------------------------------------------------------------------- |
| **Service Type** | Filter by **All**, **Chat (LLM)**, or **TTS**. |
| **Model** | View requests for a specific model only. |
| **API Key** | View requests made using a specific API key. |
| **Date Range** | Select the time range to analyze. |
| **Time Interval** | Choose the aggregation interval (for example, **1 minute** or **5 minutes**). |
| **Auto Refresh** | Enable or disable automatic updates. |
### Request History
Individual API requests are displayed in a table below the metrics.
Click **Export** to download the request history.
 | Field | Description |
| --------------- | ------------------------------------------------ |
| **Created At** | Time when the request was made. |
| **API Key** | API key used for the request. |
| **Model** | Model used for the request. |
| **Engine Type** | Request type, such as **Chat (LLM)** or **TTS**. |
| **Usage** | Number of tokens or characters processed. |
| **Latency** | Time taken to process the request. |
## Organization Usage
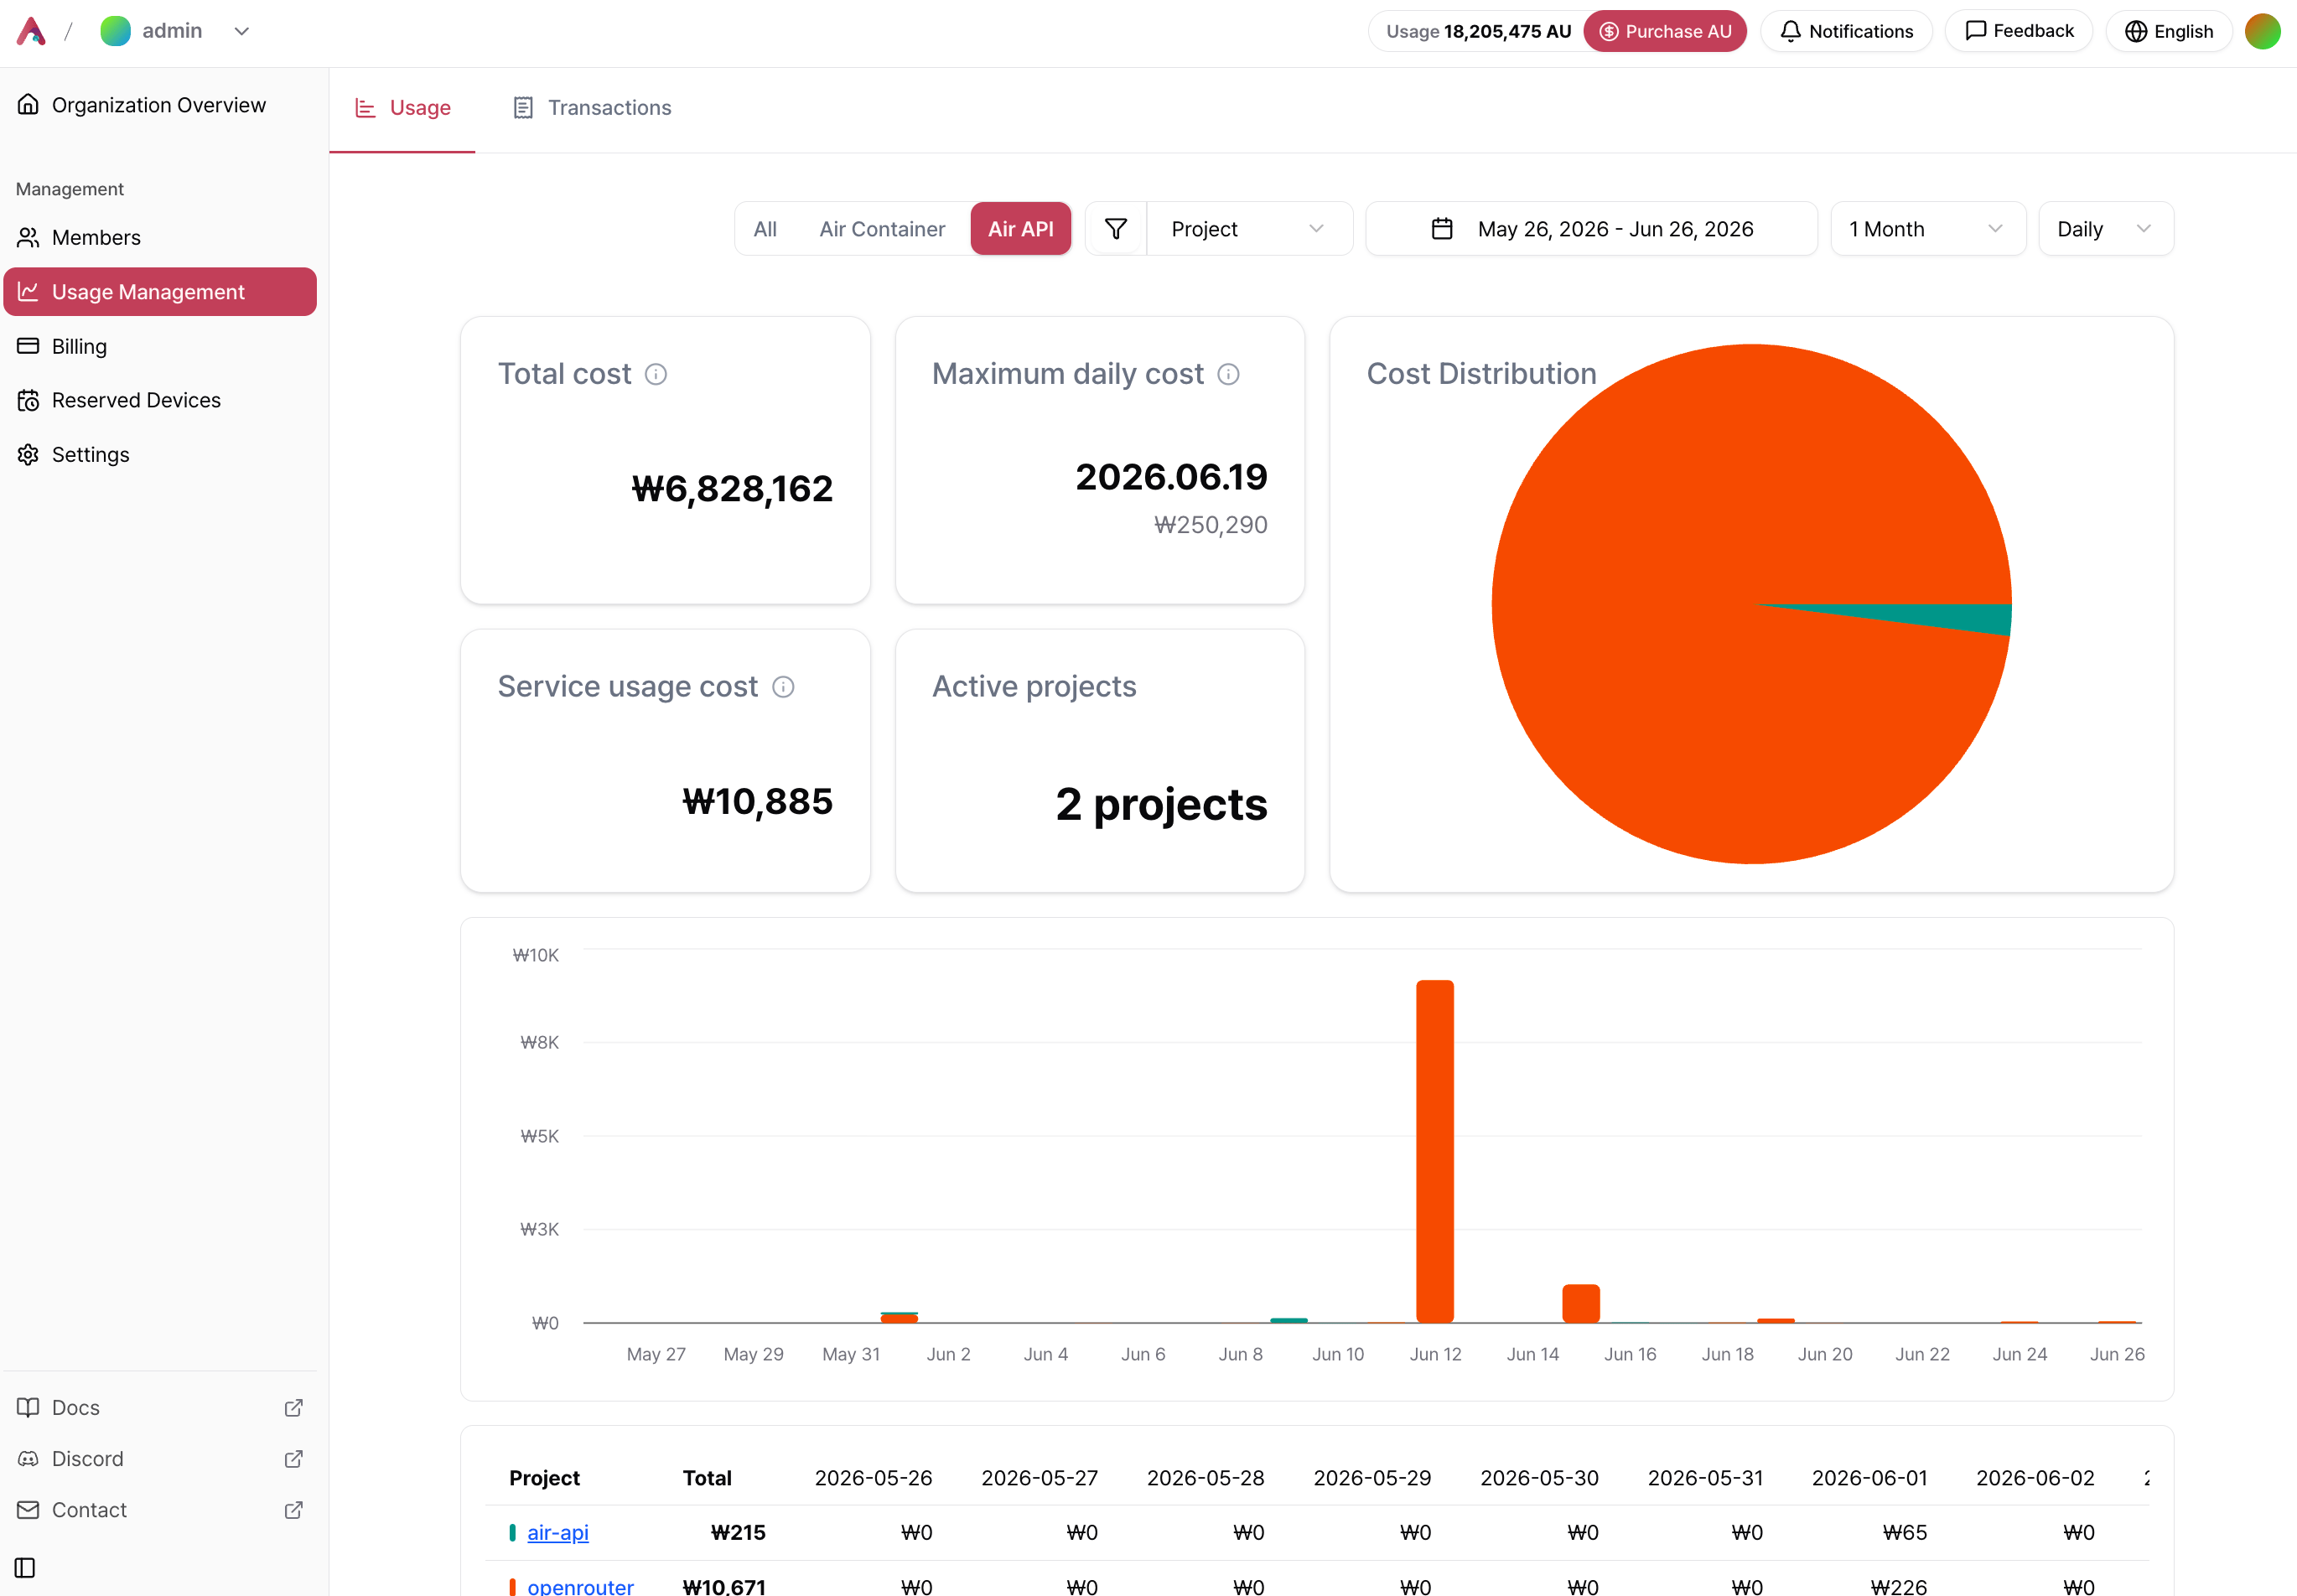
From the Organization page, navigate to **Usage Management** → **Usage**, then select the **Air API** filter to view Air API spending across all Projects within the Organization.
The table below provides a daily spending breakdown for each Project.
| Field | Description |
| --------------- | ------------------------------------------------ |
| **Created At** | Time when the request was made. |
| **API Key** | API key used for the request. |
| **Model** | Model used for the request. |
| **Engine Type** | Request type, such as **Chat (LLM)** or **TTS**. |
| **Usage** | Number of tokens or characters processed. |
| **Latency** | Time taken to process the request. |
## Organization Usage
From the Organization page, navigate to **Usage Management** → **Usage**, then select the **Air API** filter to view Air API spending across all Projects within the Organization.
The table below provides a daily spending breakdown for each Project.
 ### Metrics
| Metric | Description |
| ---------------------- | --------------------------------------------------------------------- |
| **Total Cost** | Total Air API spending during the selected period. |
| **Highest Daily Cost** | The highest daily spending amount and the corresponding date. |
| **Cost Distribution** | Pie chart showing spending by Project. |
| **Service Cost** | Combined spending for other services, such as Air Container. |
| **Active Projects** | Number of Projects that made API requests during the selected period. |
## Related Documentation
Learn how to authenticate and call Air API.
Learn about AU-based billing and the refund policy.
### Metrics
| Metric | Description |
| ---------------------- | --------------------------------------------------------------------- |
| **Total Cost** | Total Air API spending during the selected period. |
| **Highest Daily Cost** | The highest daily spending amount and the corresponding date. |
| **Cost Distribution** | Pie chart showing spending by Project. |
| **Service Cost** | Combined spending for other services, such as Air Container. |
| **Active Projects** | Number of Projects that made API requests during the selected period. |
## Related Documentation
Learn how to authenticate and call Air API.
Learn about AU-based billing and the refund policy.